

Долзарб паттернлар

Медвежий симметричный треугольник
сформирован 25.03 в 21:36:34 (UTC+0)
сила сигнала 2 из 5
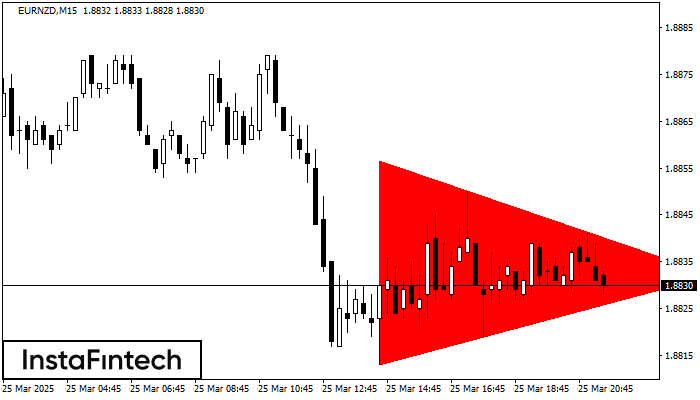
На графике EURNZD на M15 сформировалась фигура «Медвежий симметричный треугольник». Торговые рекомендации: Пробой нижней границы 1.8813 с большой долей вероятности приведет к продолжению нисходящего тренда.
Таймфреймы М5 и М15 могут иметь больше ложных точек входа.
Шунингдек кўринг
- Все
- Все
- Bearish Rectangle
- Bearish Symmetrical Triangle
- Bearish Symmetrical Triangle
- Bullish Rectangle
- Double Top
- Double Top
- Triple Bottom
- Triple Bottom
- Triple Top
- Triple Top
- Все
- Все
- Покупка
- Продажа
- Все
- 1
- 2
- 3
- 4
- 5
Triple Bottom
was formed on 11.04 at 15:45:01 (UTC+0)
signal strength 2 of 5
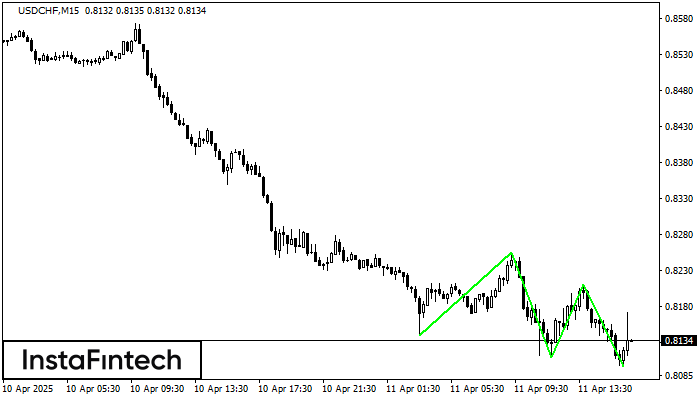
The Triple Bottom pattern has formed on the chart of the USDCHF M15 trading instrument. The pattern signals a change in the trend from downwards to upwards in the case
The M5 and M15 time frames may have more false entry points.
Open chart in a new window
Double Bottom
was formed on 11.04 at 15:25:04 (UTC+0)
signal strength 1 of 5
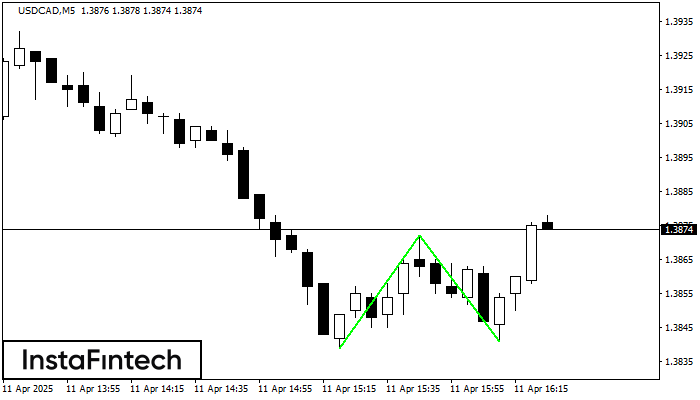
The Double Bottom pattern has been formed on USDCAD M5. Characteristics: the support level 1.3839; the resistance level 1.3872; the width of the pattern 33 points. If the resistance level
The M5 and M15 time frames may have more false entry points.
Open chart in a new window
Bearish Rectangle
was formed on 11.04 at 15:08:43 (UTC+0)
signal strength 4 of 5
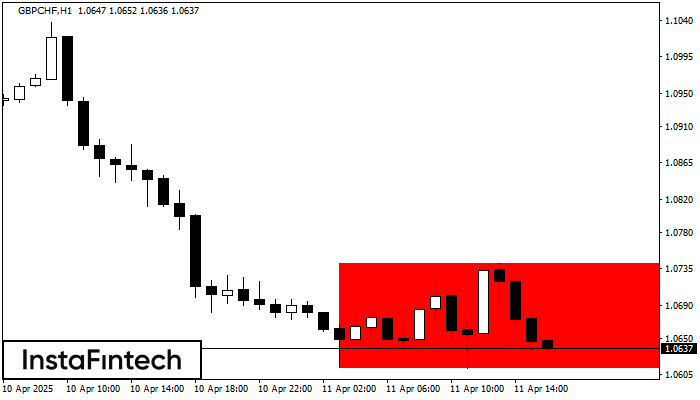
According to the chart of H1, GBPCHF formed the Bearish Rectangle. The pattern indicates a trend continuation. The upper border is 1.0742, the lower border is 1.0613. The signal means
Open chart in a new window


