

Долзарб паттернлар

Актуальные паттерны
- Все
- Все
- Bearish Rectangle
- Bearish Symmetrical Triangle
- Bearish Symmetrical Triangle
- Bullish Rectangle
- Double Top
- Double Top
- Triple Bottom
- Triple Bottom
- Triple Top
- Triple Top
- Все
- Все
- Покупка
- Продажа
- Все
- 1
- 2
- 3
- 4
- 5
Двойная вершина
сформирован 17.04 в 18:15:13 (UTC+0)
сила сигнала 1 из 5
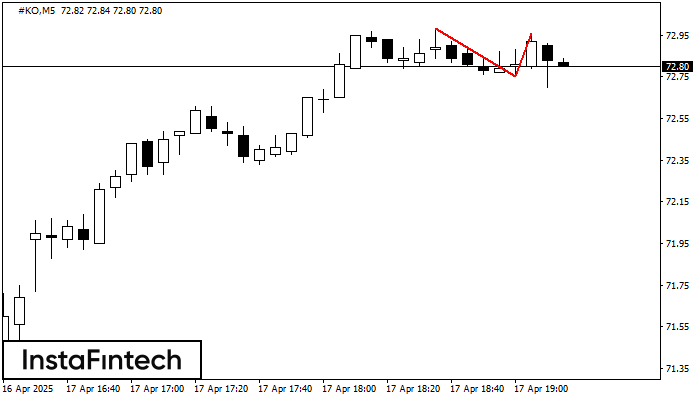
На торговом графике #KO M5 сформировалась разворотная фигура «Двойная вершина». Характеристика: Верхняя граница 72.96; Нижняя граница 72.75; Ширина фигуры 21 пунктов. Сигнал: Пробой нижней границы 72.75 приведет к дальнейшему нисходящему
Таймфреймы М5 и М15 могут иметь больше ложных точек входа.
Открыть график инструмента в новом окне
Двойное дно
сформирован 17.04 в 18:00:01 (UTC+0)
сила сигнала 1 из 5
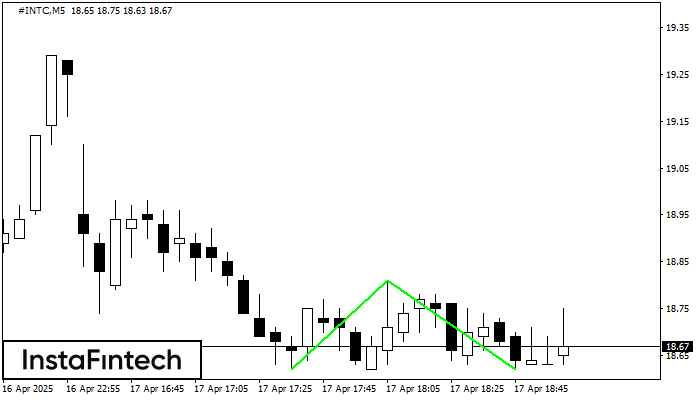
Сформирована фигура «Двойное дно» на графике #INTC M5. Верхняя граница 18.81; Нижняя граница 18.62; Ширина фигуры 19 пунктов. В случае пробоя верхней границы 18.81 можно будет прогнозировать изменение тенденции
Таймфреймы М5 и М15 могут иметь больше ложных точек входа.
Открыть график инструмента в новом окне
Тройная вершина
сформирован 17.04 в 17:45:29 (UTC+0)
сила сигнала 1 из 5

На графике NZDCAD M5 образовалась фигура «Тройная вершина». Данная фигура относится к типу разворотных и имеет характеристику: Верхняя граница 0.8272/0.8273; Нижняя граница 0.8255/0.8261; Ширина фигуры 10 пунктов. Прогноз: В случае
Таймфреймы М5 и М15 могут иметь больше ложных точек входа.
Открыть график инструмента в новом окне
Перевернутая голова и плечи
сформирован 17.04 в 17:44:51 (UTC+0)
сила сигнала 1 из 5
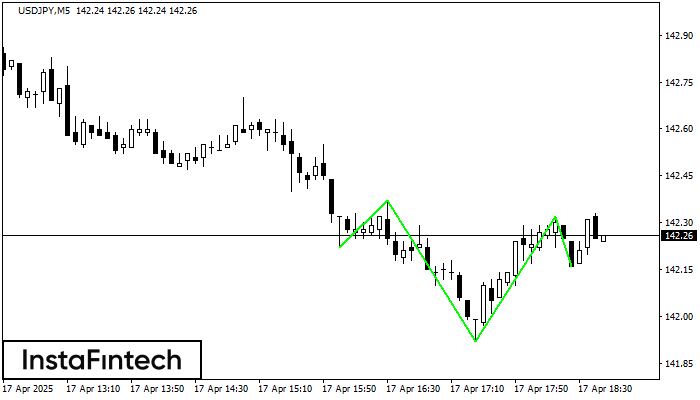
По USDJPY на M5 сформировалась фигура «Перевернутая голова и плечи». Голова закреплена на 141.92, при этом средняя линия шеи расположена на 142.37/142.32. Формирование фигуры «Перевернутая голова и плечи» наиболее вероятным
Таймфреймы М5 и М15 могут иметь больше ложных точек входа.
Открыть график инструмента в новом окне
Двойное дно
сформирован 17.04 в 17:14:56 (UTC+0)
сила сигнала 2 из 5
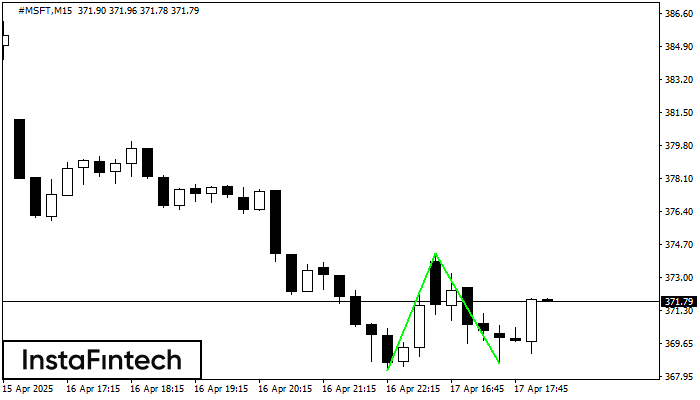
Сформирована фигура «Двойное дно» на графике #MSFT M15. Данное формирование сигнализирует об изменении тенденции с нисходящего на восходящее движение. Сигнал: Торговую позицию на покупку следует открывать после пробоя верхней границы
Таймфреймы М5 и М15 могут иметь больше ложных точек входа.
Открыть график инструмента в новом окне
Двойное дно
сформирован 17.04 в 17:14:47 (UTC+0)
сила сигнала 2 из 5
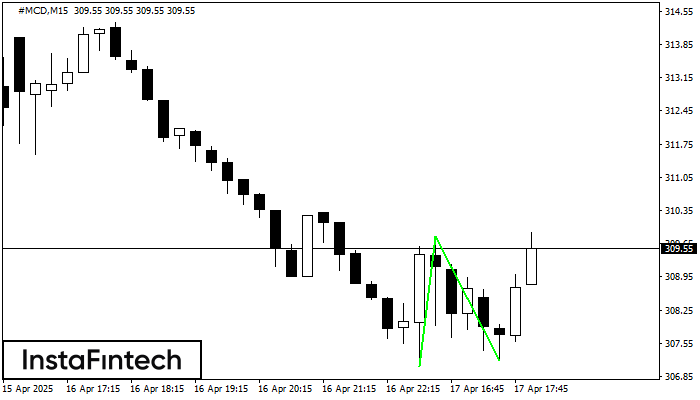
Сформирована фигура «Двойное дно» на графике #MCD M15. Характеристика: Уровень поддержки 307.06; Уровень сопротивления 309.81; Ширина фигуры 275 пунктов. В случае пробоя уровня сопротивления можно будет прогнозировать изменение тенденции
Таймфреймы М5 и М15 могут иметь больше ложных точек входа.
Открыть график инструмента в новом окне
Двойная вершина
сформирован 17.04 в 17:00:07 (UTC+0)
сила сигнала 3 из 5
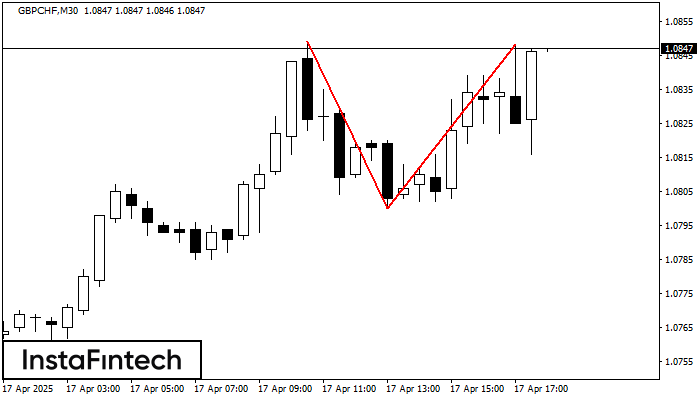
По торговому инструменту GBPCHF на M30 сформировалась фигура «Двойная вершина», которая сигнализирует нам об изменении тенденции с восходящей на нисходящую. Вероятно, что, в случае пробоя основания фигуры 1.0800, возможно дальнейшее
Открыть график инструмента в новом окне
Двойное дно
сформирован 17.04 в 16:54:34 (UTC+0)
сила сигнала 1 из 5
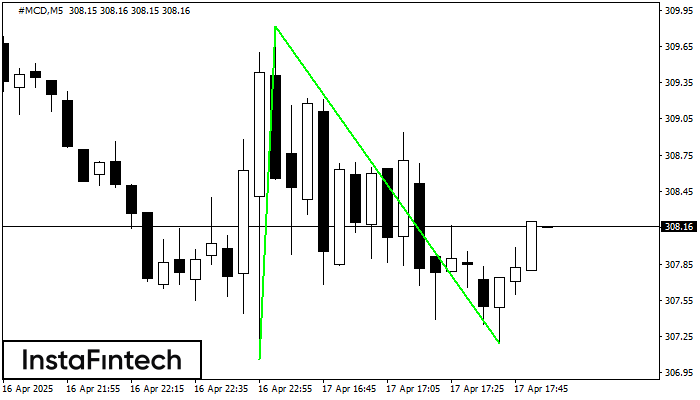
Сформирована фигура «Двойное дно» на графике #MCD M5. Характеристика: Уровень поддержки 307.06; Уровень сопротивления 309.81; Ширина фигуры 275 пунктов. В случае пробоя уровня сопротивления можно будет прогнозировать изменение тенденции
Таймфреймы М5 и М15 могут иметь больше ложных точек входа.
Открыть график инструмента в новом окне
Двойная вершина
сформирован 17.04 в 16:39:50 (UTC+0)
сила сигнала 1 из 5
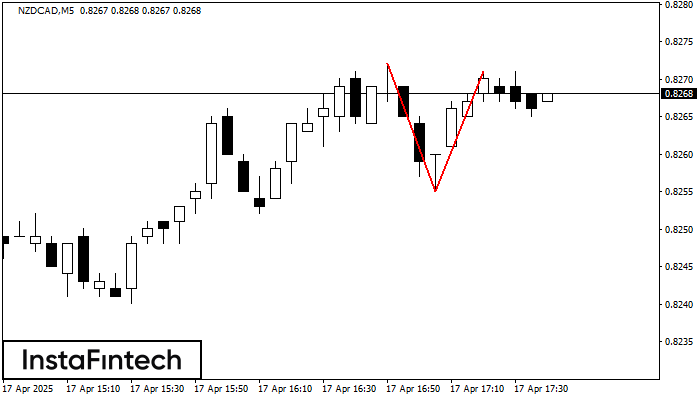
По торговому инструменту NZDCAD на M5 сформировалась фигура «Двойная вершина», которая сигнализирует нам об изменении тенденции с восходящей на нисходящую. Вероятно, что, в случае пробоя основания фигуры 0.8255, возможно дальнейшее
Таймфреймы М5 и М15 могут иметь больше ложных точек входа.
Открыть график инструмента в новом окне


