

Actual patterns

Patterns are graphical models which are formed in the chart by the price. According to one of the technical analysis postulates, history (price movement) repeats itself. It means that the price movements are often similar in the same situations which makes it possible to predict the further development of the situation with a high probability.
Relevant patterns by InstaTrade is an easy-to-use service which allows you to be aware of latest changes in the market and react to clues from the market in time. In our service you will always find the latest and most relevant patterns on any pair and any timeframe.
Bearish Rectangle
was formed on 16.04 at 05:35:30 (UTC+0)
signal strength 1 of 5
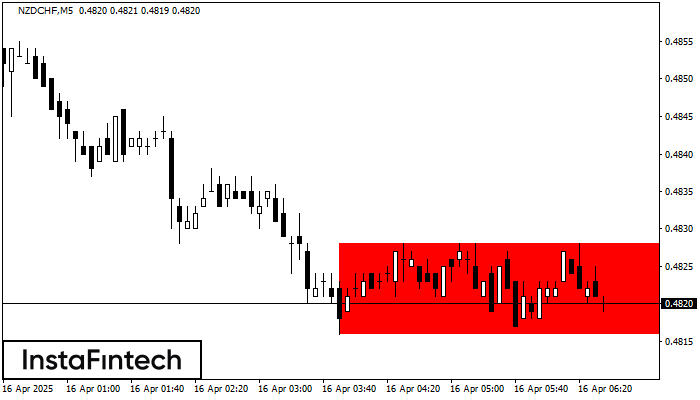
According to the chart of M5, NZDCHF formed the Bearish Rectangle. This type of a pattern indicates a trend continuation. It consists of two levels: resistance 0.4828 - 0.0000 and support 0.4816 – 0.4816. In case the resistance level 0.4816 - 0.4816 is broken, the instrument is likely to follow the bearish trend.
The M5 and M15 time frames may have more false entry points.
- All
- All
- Bearish Rectangle
- Bearish Symmetrical Triangle
- Bearish Symmetrical Triangle
- Bullish Rectangle
- Double Top
- Double Top
- Triple Bottom
- Triple Bottom
- Triple Top
- Triple Top
- All
- All
- Buy
- Sale
- All
- 1
- 2
- 3
- 4
- 5
Fundo duplo
was formed on 30.05 at 09:30:30 (UTC+0)
signal strength 1 of 5
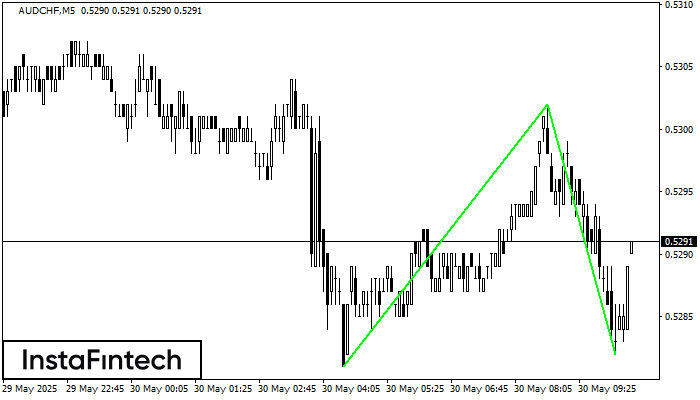
O padrão Fundo duplo foi formado em AUDCHF M5. Características: o nível de suporte 0.5281; o nível de resistência 0.5302; a largura do padrão 21 pontos. Se o nível
Os intervalos M5 e M15 podem ter mais pontos de entrada falsos.
Open chart in a new window
Fundo duplo
was formed on 30.05 at 09:30:14 (UTC+0)
signal strength 2 of 5
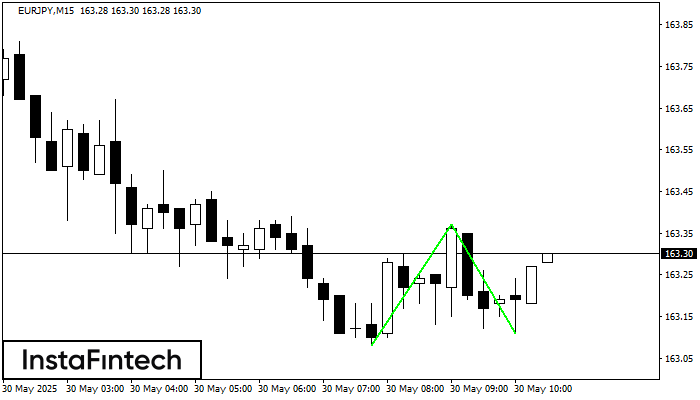
O padrão Fundo duplo foi formado em EURJPY M15. Características: o nível de suporte 163.08; o nível de resistência 163.37; a largura do padrão 29 pontos. Se o nível
Os intervalos M5 e M15 podem ter mais pontos de entrada falsos.
Open chart in a new window
Fundo triplo
was formed on 30.05 at 09:00:12 (UTC+0)
signal strength 4 of 5
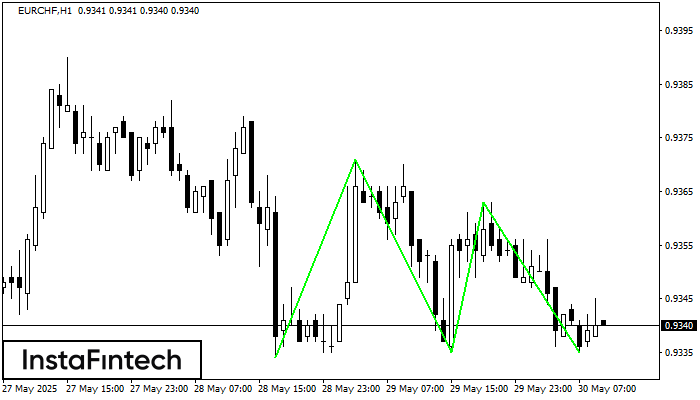
O padrão Fundo triplo foi formado no gráfico de EURCHF H1. Características do padrão: A linha inferior do padrão tem coordenadas 0.9371 com o limite superior 0.9371/0.9363, a projeção
Open chart in a new window


