

Actual patterns

Patterns are graphical models which are formed in the chart by the price. According to one of the technical analysis postulates, history (price movement) repeats itself. It means that the price movements are often similar in the same situations which makes it possible to predict the further development of the situation with a high probability.
Relevant patterns by InstaTrade is an easy-to-use service which allows you to be aware of latest changes in the market and react to clues from the market in time. In our service you will always find the latest and most relevant patterns on any pair and any timeframe.
Bullish Rectangle
was formed on 31.03 at 05:26:24 (UTC+0)
signal strength 1 of 5
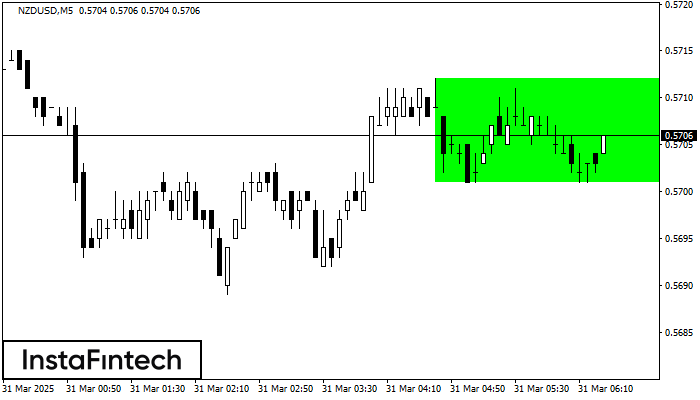
According to the chart of M5, NZDUSD formed the Bullish Rectangle. This type of a pattern indicates a trend continuation. It consists of two levels: resistance 0.5712 and support 0.5701. In case the resistance level 0.5712 - 0.5712 is broken, the instrument is likely to follow the bullish trend.
The M5 and M15 time frames may have more false entry points.
- All
- All
- Bearish Rectangle
- Bearish Symmetrical Triangle
- Bearish Symmetrical Triangle
- Bullish Rectangle
- Double Top
- Double Top
- Triple Bottom
- Triple Bottom
- Triple Top
- Triple Top
- All
- All
- Buy
- Sale
- All
- 1
- 2
- 3
- 4
- 5
Triângulo Simétrico de Alta
was formed on 15.06 at 05:27:21 (UTC+0)
signal strength 1 of 5
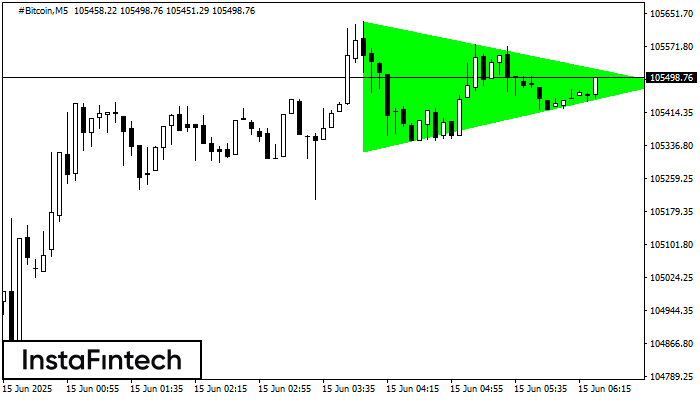
De acordo com o gráfico de M5, #Bitcoin formaram o padrão de Triângulo Simétrico de Alta. Descrição: Este é o padrão de uma continuação de tendência. 105631.72 e 105322.26
Os intervalos M5 e M15 podem ter mais pontos de entrada falsos.
Open chart in a new window
Topo triplo
was formed on 15.06 at 02:10:13 (UTC+0)
signal strength 1 of 5
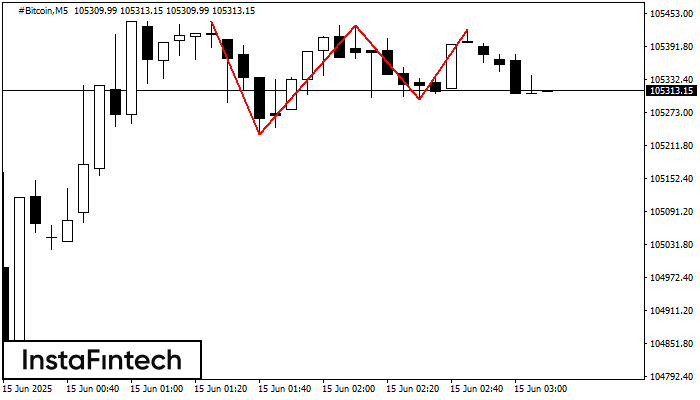
O padrão Topo triplo foi formado no gráfico do instrumento de negociação #Bitcoin M5. É um padrão de reversão com as seguintes características: nível de resistência 1384, nível de suporte
Os intervalos M5 e M15 podem ter mais pontos de entrada falsos.
Open chart in a new window
Topo duplo
was formed on 15.06 at 01:20:09 (UTC+0)
signal strength 1 of 5
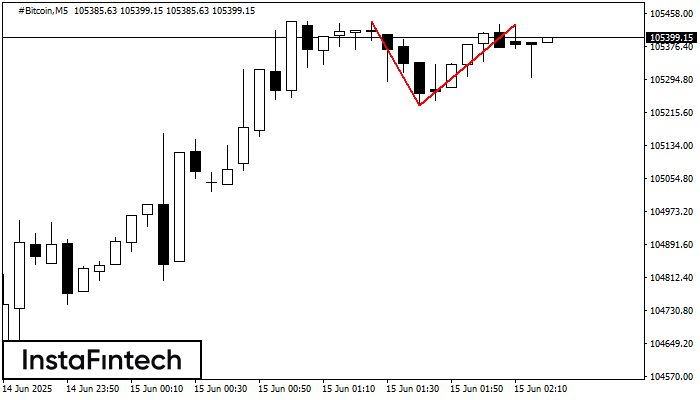
No gráfico de #Bitcoin M5 o padrão de reversão Topo duplo foi formado. Características: o limite superior 105430.30; o limite inferior 105231.35; a largura do padrão 19895 pontos. O sinal
Os intervalos M5 e M15 podem ter mais pontos de entrada falsos.
Open chart in a new window


