

Actual patterns

Patterns are graphical models which are formed in the chart by the price. According to one of the technical analysis postulates, history (price movement) repeats itself. It means that the price movements are often similar in the same situations which makes it possible to predict the further development of the situation with a high probability.
Relevant patterns by InstaTrade is an easy-to-use service which allows you to be aware of latest changes in the market and react to clues from the market in time. In our service you will always find the latest and most relevant patterns on any pair and any timeframe.
Bullish pennant
was formed on 25.03 at 20:30:24 (UTC+0)
signal strength 4 of 5
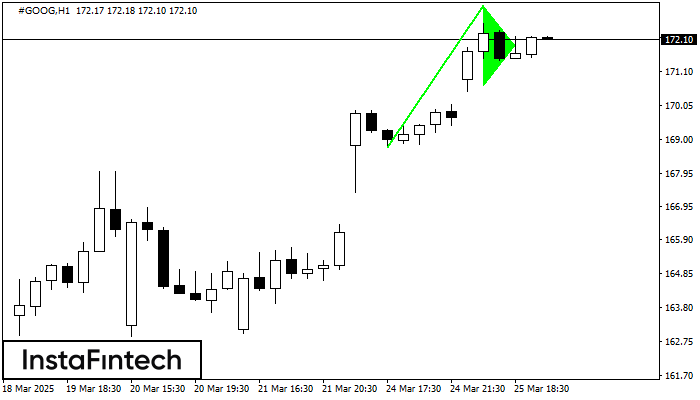
The Bullish pennant signal – Trading instrument #GOOG H1, continuation pattern. Forecast: it is possible to set up a buy position above the pattern’s high of 173.16, with the prospect of the next move being a projection of the flagpole height.
- All
- All
- Bearish Rectangle
- Bearish Symmetrical Triangle
- Bearish Symmetrical Triangle
- Bullish Rectangle
- Double Top
- Double Top
- Triple Bottom
- Triple Bottom
- Triple Top
- Triple Top
- All
- All
- Buy
- Sale
- All
- 1
- 2
- 3
- 4
- 5
Fundo duplo
was formed on 15.05 at 03:40:41 (UTC+0)
signal strength 1 of 5
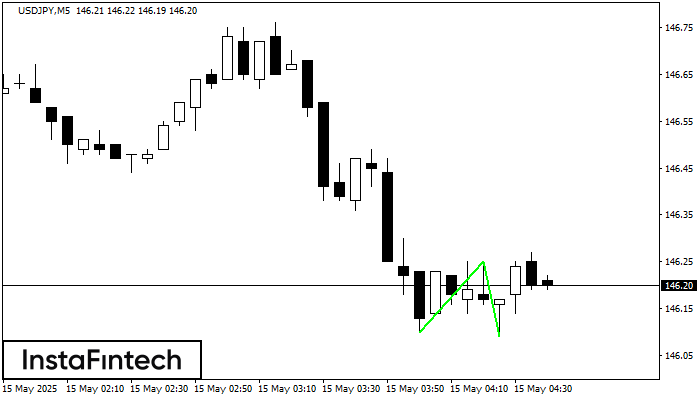
O padrão Fundo duplo foi formado em USDJPY M5; o limite superior é 146.25; o limite inferior é 146.09. A largura do padrão é de 15 pontos. No caso
Os intervalos M5 e M15 podem ter mais pontos de entrada falsos.
Open chart in a new window
Fundo duplo
was formed on 15.05 at 03:35:27 (UTC+0)
signal strength 1 of 5
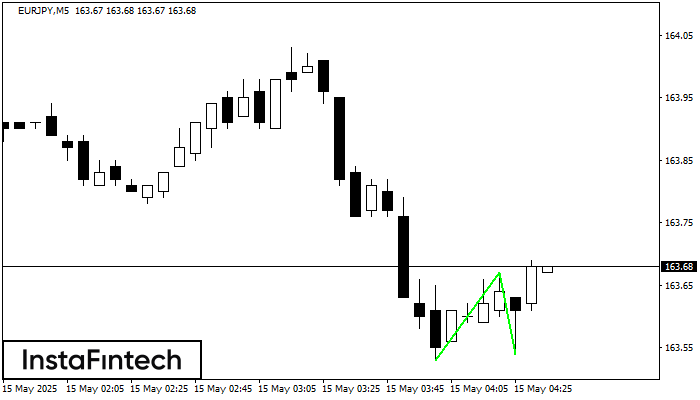
O padrão Fundo duplo foi formado em EURJPY M5; o limite superior é 163.67; o limite inferior é 163.54. A largura do padrão é de 14 pontos. No caso
Os intervalos M5 e M15 podem ter mais pontos de entrada falsos.
Open chart in a new window
Fundo triplo
was formed on 15.05 at 03:00:19 (UTC+0)
signal strength 3 of 5
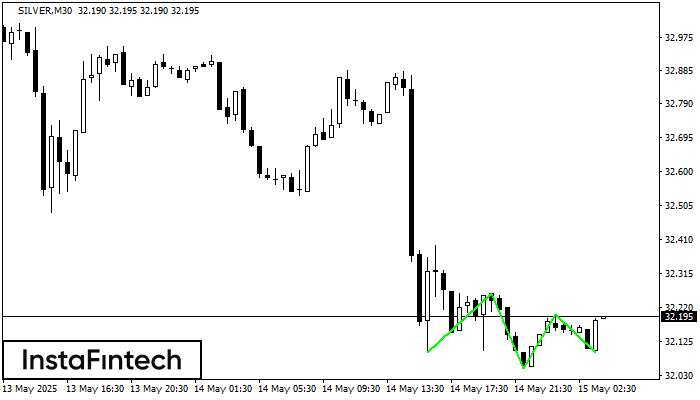
O padrão Fundo triplo foi formado no gráfico do instrumento de negociação SILVER M30. O padrão sinaliza uma mudança na tendência de baixa para alta no caso de quebra
Open chart in a new window


