

Corak sebenar

Bearish Symmetrical Triangle
was formed on 23.04 at 13:22:55 (UTC+0)
signal strength 1 of 5

According to the chart of M5, EURJPY formed the Bearish Symmetrical Triangle pattern. Description: The lower border is 161.15/161.86 and upper border is 162.37/161.86. The pattern width is measured on the chart at -122 pips. The formation of the Bearish Symmetrical Triangle pattern evidently signals a continuation of the downward trend. In other words, if the scenario comes true and EURJPY breaches the lower border, the price could continue its move toward 161.71.
The M5 and M15 time frames may have more false entry points.
Juga lihat
- All
- All
- Bearish Rectangle
- Bearish Symmetrical Triangle
- Bearish Symmetrical Triangle
- Bullish Rectangle
- Double Top
- Double Top
- Triple Bottom
- Triple Bottom
- Triple Top
- Triple Top
- All
- All
- Buy
- Sale
- All
- 1
- 2
- 3
- 4
- 5
Double Bottom
was formed on 06.05 at 07:00:35 (UTC+0)
signal strength 3 of 5
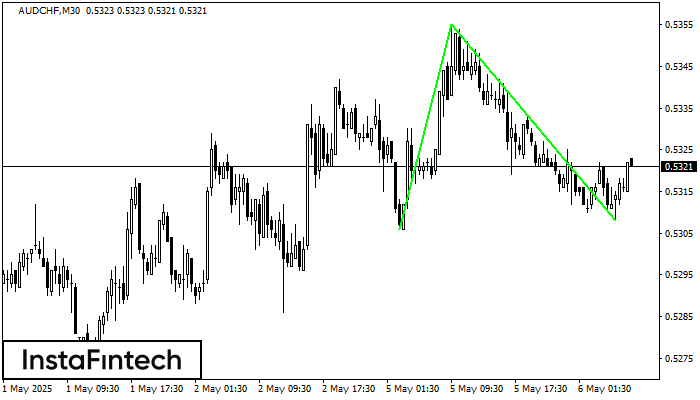
Corak Double Bottom telah dibentuk pada AUDCHF M30. Pembentukan ini menandakan pembalikan aliran dari aliran menurun ke atas. Isyarat ialah perdagangan membeli harus dibuka selepas sempadan atas corak 0.5355 telah
Open chart in a new window
Inverse Head dan Shoulder
was formed on 06.05 at 06:45:50 (UTC+0)
signal strength 1 of 5
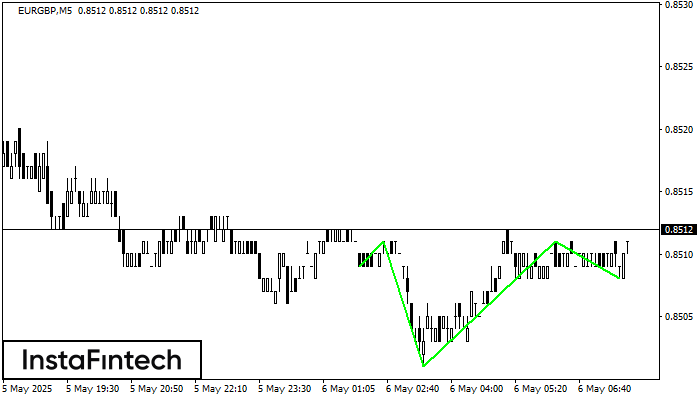
Berdasarkan carta M5, EURGBP membentuk corak Inverse Head dan Shoulder. Bahagian atas Head ditetapkan pada 0.8511 manakala garisan median Neck didapati pada 0.8501/0.8508. Pembentukan corak Inverse Head dan Shoulder jelas
Carta masa M5 dan M15 mungkin mempunyai lebih banyak titik kemasukan palsu.
Open chart in a new window
Double Bottom
was formed on 06.05 at 06:30:39 (UTC+0)
signal strength 3 of 5
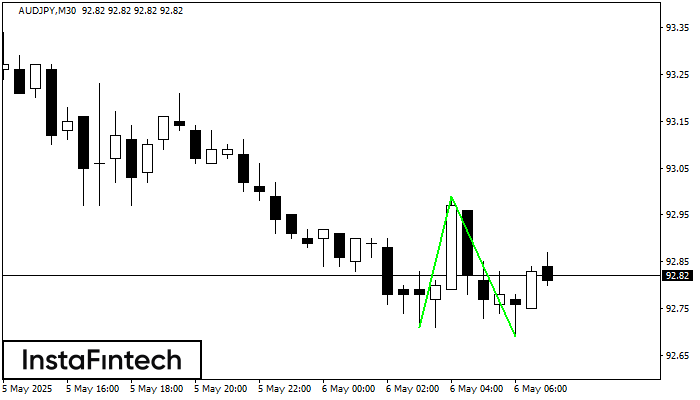
Corak Double Bottom telah dibentuk pada AUDJPY M30. Pembentukan ini menandakan pembalikan aliran dari aliran menurun ke atas. Isyarat ialah perdagangan membeli harus dibuka selepas sempadan atas corak 92.99 telah
Open chart in a new window


