

Corak sebenar

Triple Bottom
was formed on 23.04 at 12:15:11 (UTC+0)
signal strength 2 of 5

The Triple Bottom pattern has formed on the chart of the USDJPY M15 trading instrument. The pattern signals a change in the trend from downwards to upwards in the case of breakdown of 142.25/141.96.
The M5 and M15 time frames may have more false entry points.
- All
- All
- Bearish Rectangle
- Bearish Symmetrical Triangle
- Bearish Symmetrical Triangle
- Bullish Rectangle
- Double Top
- Double Top
- Triple Bottom
- Triple Bottom
- Triple Top
- Triple Top
- All
- All
- Buy
- Sale
- All
- 1
- 2
- 3
- 4
- 5
Bearish pennant
was formed on 06.05 at 17:30:46 (UTC+0)
signal strength 3 of 5
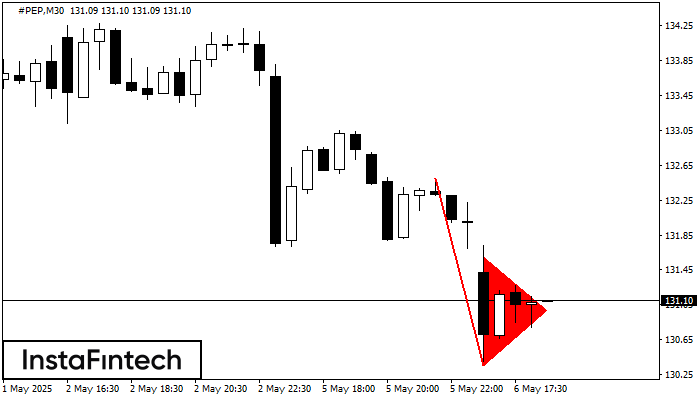
The Bearish pennant pattern has formed on the #PEP M30 chart. It signals potential continuation of the existing trend. Specifications: the pattern’s bottom has the coordinate of 130.36; the projection
Open chart in a new window
Bearish pennant
was formed on 06.05 at 17:30:37 (UTC+0)
signal strength 3 of 5

The Bearish pennant pattern has formed on the #PEP M30 chart. It signals potential continuation of the existing trend. Specifications: the pattern’s bottom has the coordinate of 130.36; the projection
Open chart in a new window
Double Top
was formed on 06.05 at 16:45:22 (UTC+0)
signal strength 1 of 5
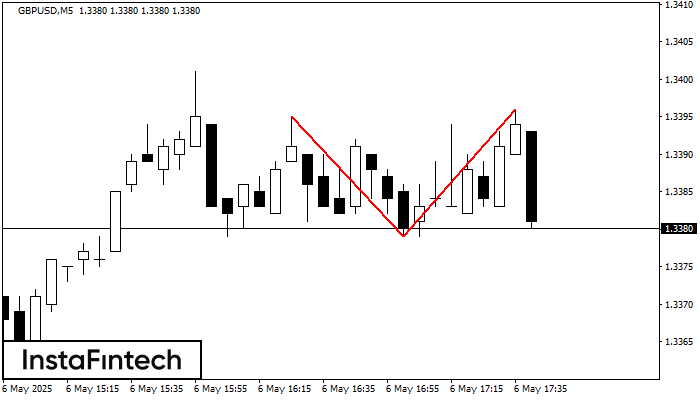
The Double Top reversal pattern has been formed on GBPUSD M5. Characteristics: the upper boundary 1.3395; the lower boundary 1.3379; the width of the pattern is 17 points. Sell trades
The M5 and M15 time frames may have more false entry points.
Open chart in a new window


