

Corak sebenar

Bullish pennant
was formed on 23.04 at 07:10:00 (UTC+0)
signal strength 1 of 5
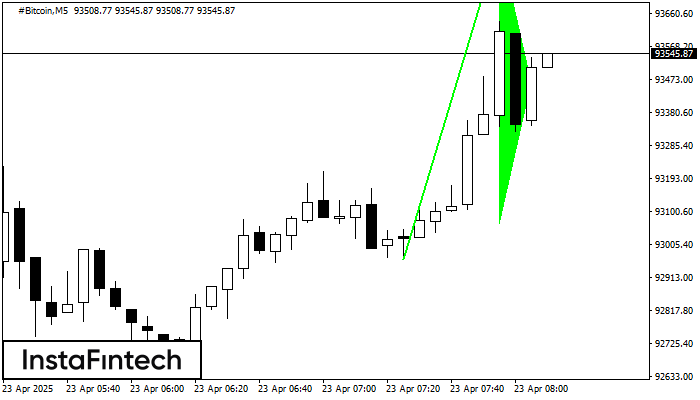
The Bullish pennant signal – Trading instrument #Bitcoin M5, continuation pattern. Forecast: it is possible to set up a buy position above the pattern’s high of 93868.36, with the prospect of the next move being a projection of the flagpole height.
The M5 and M15 time frames may have more false entry points.
- All
- All
- Bearish Rectangle
- Bearish Symmetrical Triangle
- Bearish Symmetrical Triangle
- Bullish Rectangle
- Double Top
- Double Top
- Triple Bottom
- Triple Bottom
- Triple Top
- Triple Top
- All
- All
- Buy
- Sale
- All
- 1
- 2
- 3
- 4
- 5
Bearish Symmetrical Triangle
was formed on 15.05 at 00:37:45 (UTC+0)
signal strength 1 of 5
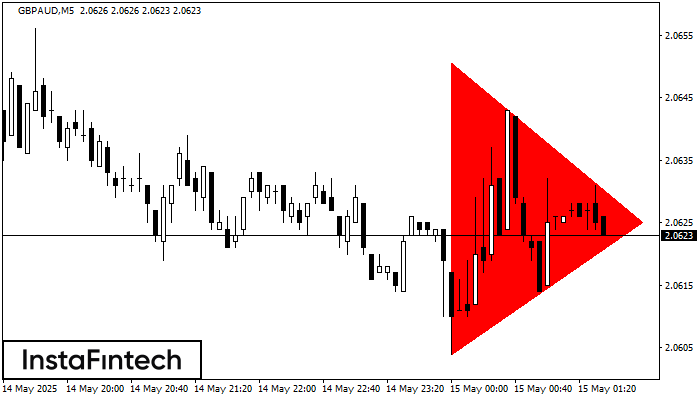
According to the chart of M5, GBPAUD formed the Bearish Symmetrical Triangle pattern. Trading recommendations: A breach of the lower border 2.0604 is likely to encourage a continuation
The M5 and M15 time frames may have more false entry points.
Open chart in a new window
Double Top
was formed on 15.05 at 00:04:58 (UTC+0)
signal strength 1 of 5
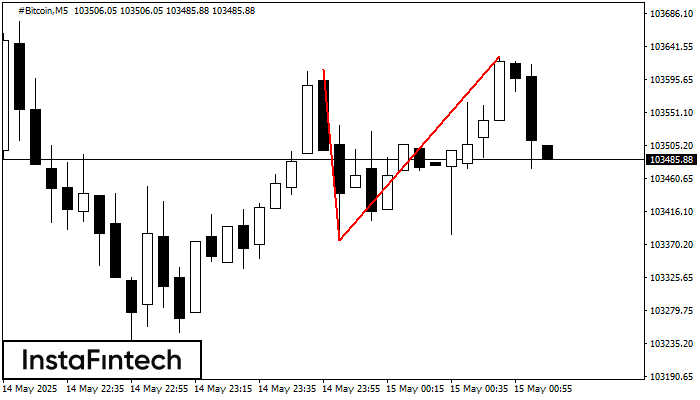
On the chart of #Bitcoin M5 the Double Top reversal pattern has been formed. Characteristics: the upper boundary 103626.65; the lower boundary 103376.20; the width of the pattern 25045 points
The M5 and M15 time frames may have more false entry points.
Open chart in a new window
Bullish Rectangle
was formed on 15.05 at 00:00:52 (UTC+0)
signal strength 2 of 5
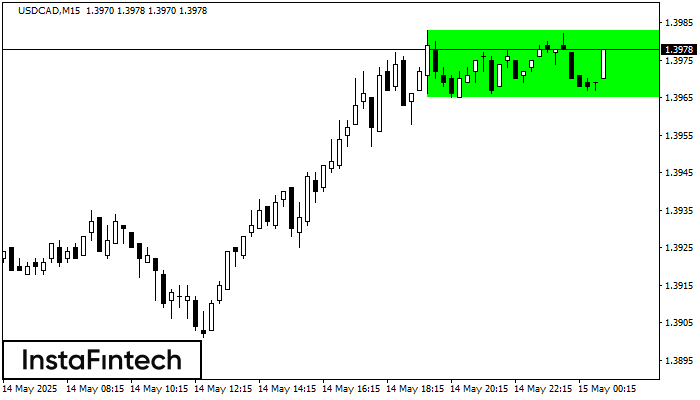
According to the chart of M15, USDCAD formed the Bullish Rectangle. This type of a pattern indicates a trend continuation. It consists of two levels: resistance 1.3983 and support 1.3965
The M5 and M15 time frames may have more false entry points.
Open chart in a new window


