

Corak sebenar

Triple Top
was formed on 23.04 at 02:30:18 (UTC+0)
signal strength 1 of 5

The Triple Top pattern has formed on the chart of the #Bitcoin M5. Features of the pattern: borders have an ascending angle; the lower line of the pattern has the coordinates 92581.54/93324.30 with the upper limit 94049.90/93865.04; the projection of the width is 146836 points. The formation of the Triple Top figure most likely indicates a change in the trend from upward to downward. This means that in the event of a breakdown of the support level of 92581.54, the price is most likely to continue the downward movement.
The M5 and M15 time frames may have more false entry points.
- All
- All
- Bearish Rectangle
- Bearish Symmetrical Triangle
- Bearish Symmetrical Triangle
- Bullish Rectangle
- Double Top
- Double Top
- Triple Bottom
- Triple Bottom
- Triple Top
- Triple Top
- All
- All
- Buy
- Sale
- All
- 1
- 2
- 3
- 4
- 5
Bullish Rectangle
was formed on 14.05 at 07:47:39 (UTC+0)
signal strength 3 of 5
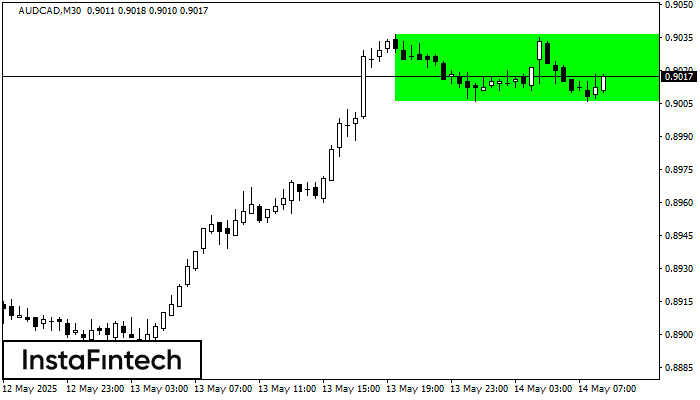
According to the chart of M30, AUDCAD formed the Bullish Rectangle. This type of a pattern indicates a trend continuation. It consists of two levels: resistance 0.9036 and support 0.9006
Open chart in a new window
Triple Bottom
was formed on 14.05 at 07:45:28 (UTC+0)
signal strength 2 of 5
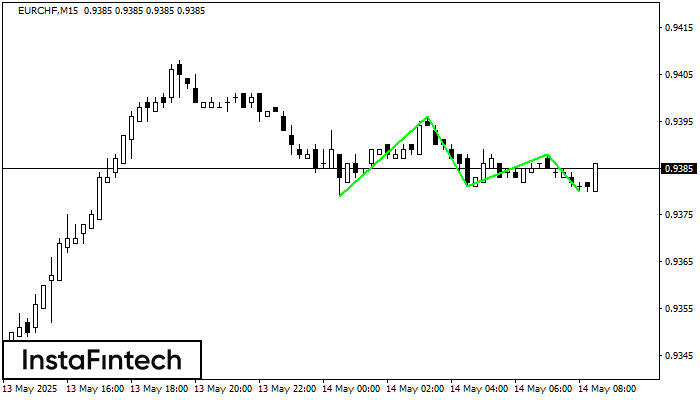
The Triple Bottom pattern has formed on the chart of the EURCHF M15 trading instrument. The pattern signals a change in the trend from downwards to upwards in the case
The M5 and M15 time frames may have more false entry points.
Open chart in a new window
Triple Bottom
was formed on 14.05 at 07:32:26 (UTC+0)
signal strength 2 of 5
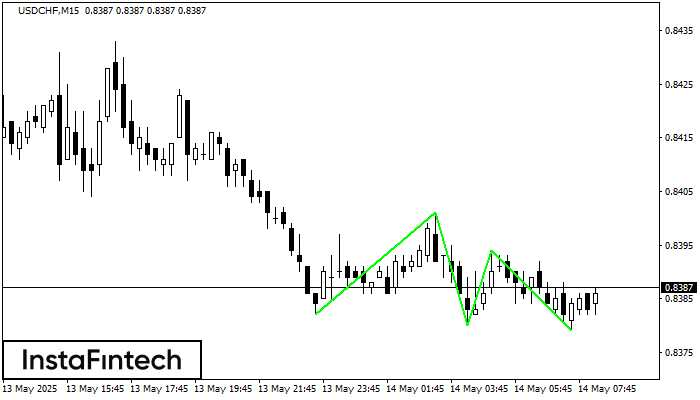
The Triple Bottom pattern has been formed on USDCHF M15. It has the following characteristics: resistance level 0.8401/0.8394; support level 0.8382/0.8379; the width is 19 points. In the event
The M5 and M15 time frames may have more false entry points.
Open chart in a new window

