

Corak sebenar

Triple Top
was formed on 22.04 at 21:55:10 (UTC+0)
signal strength 1 of 5
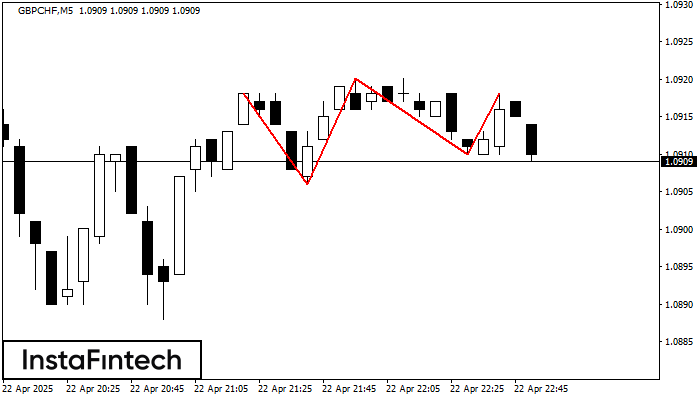
The Triple Top pattern has formed on the chart of the GBPCHF M5. Features of the pattern: borders have an ascending angle; the lower line of the pattern has the coordinates 1.0906/1.0910 with the upper limit 1.0918/1.0918; the projection of the width is 12 points. The formation of the Triple Top figure most likely indicates a change in the trend from upward to downward. This means that in the event of a breakdown of the support level of 1.0906, the price is most likely to continue the downward movement.
The M5 and M15 time frames may have more false entry points.
- All
- All
- Bearish Rectangle
- Bearish Symmetrical Triangle
- Bearish Symmetrical Triangle
- Bullish Rectangle
- Double Top
- Double Top
- Triple Bottom
- Triple Bottom
- Triple Top
- Triple Top
- All
- All
- Buy
- Sale
- All
- 1
- 2
- 3
- 4
- 5
Double Top
was formed on 14.05 at 20:35:16 (UTC+0)
signal strength 1 of 5
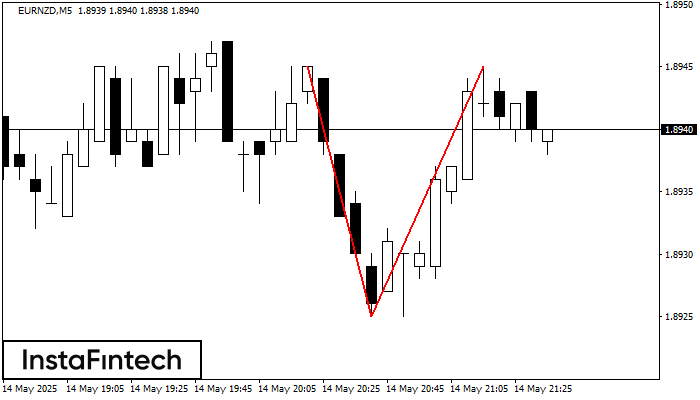
The Double Top reversal pattern has been formed on EURNZD M5. Characteristics: the upper boundary 1.8945; the lower boundary 1.8925; the width of the pattern is 20 points. Sell trades
The M5 and M15 time frames may have more false entry points.
Open chart in a new window
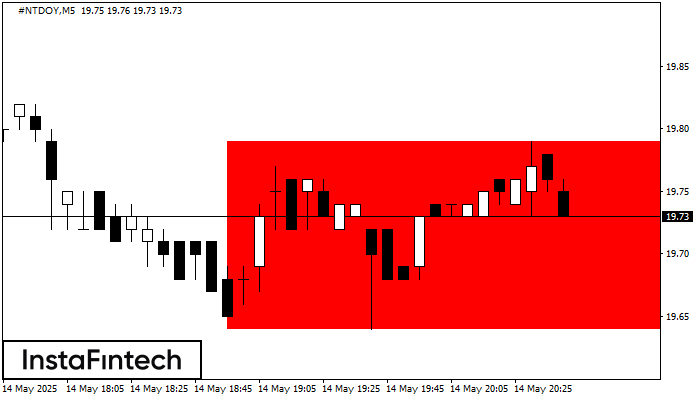
Bearish Rectangle
was formed on 14.05 at 19:42:39 (UTC+0)
signal strength 1 of 5
According to the chart of M5, #NTDOY formed the Bearish Rectangle. The pattern indicates a trend continuation. The upper border is 19.79, the lower border is 19.64. The signal means
The M5 and M15 time frames may have more false entry points.
Open chart in a new window
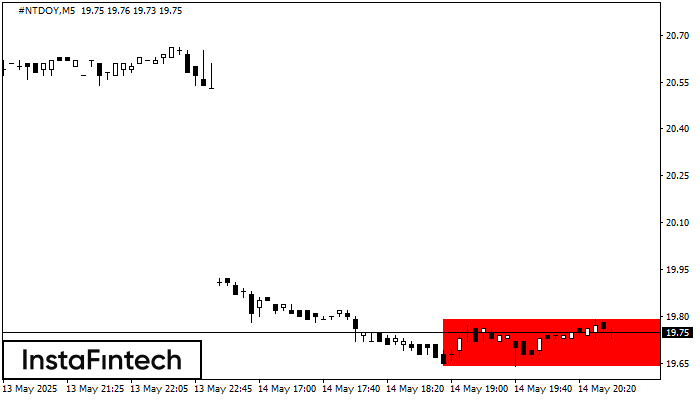
Bearish Rectangle
was formed on 14.05 at 19:42:36 (UTC+0)
signal strength 1 of 5
According to the chart of M5, #NTDOY formed the Bearish Rectangle. The pattern indicates a trend continuation. The upper border is 19.79, the lower border is 19.64. The signal means
The M5 and M15 time frames may have more false entry points.
Open chart in a new window


