

Corak sebenar

Bullish Symmetrical Triangle
was formed on 22.04 at 17:48:58 (UTC+0)
signal strength 1 of 5
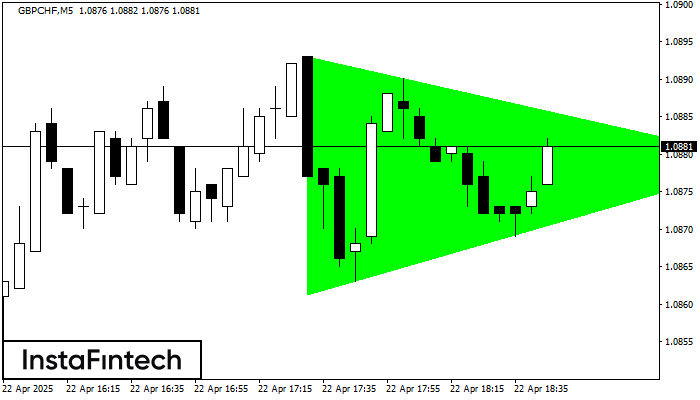
According to the chart of M5, GBPCHF formed the Bullish Symmetrical Triangle pattern. Description: This is the pattern of a trend continuation. 1.0893 and 1.0861 are the coordinates of the upper and lower borders respectively. The pattern width is measured on the chart at 32 pips. Outlook: If the upper border 1.0893 is broken, the price is likely to continue its move by 1.0894.
The M5 and M15 time frames may have more false entry points.
- All
- All
- Bearish Rectangle
- Bearish Symmetrical Triangle
- Bearish Symmetrical Triangle
- Bullish Rectangle
- Double Top
- Double Top
- Triple Bottom
- Triple Bottom
- Triple Top
- Triple Top
- All
- All
- Buy
- Sale
- All
- 1
- 2
- 3
- 4
- 5
Double Bottom
was formed on 22.05 at 03:15:53 (UTC+0)
signal strength 2 of 5
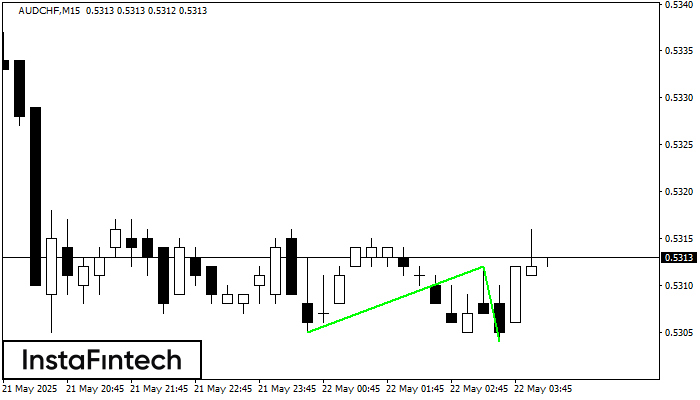
The Double Bottom pattern has been formed on AUDCHF M15; the upper boundary is 0.5312; the lower boundary is 0.5304. The width of the pattern is 7 points. In case
The M5 and M15 time frames may have more false entry points.
Open chart in a new window
Double Bottom
was formed on 22.05 at 03:00:52 (UTC+0)
signal strength 2 of 5
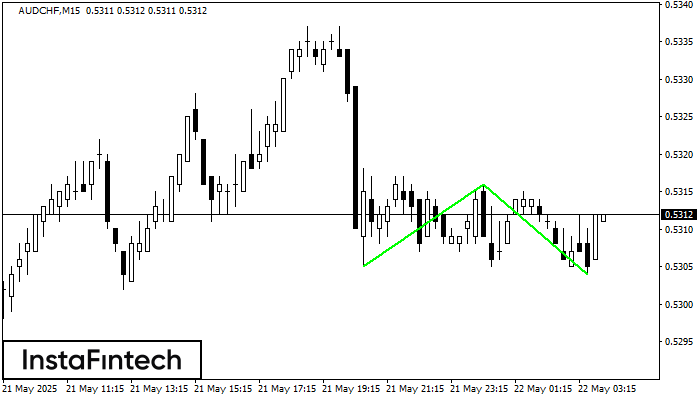
The Double Bottom pattern has been formed on AUDCHF M15. This formation signals a reversal of the trend from downwards to upwards. The signal is that a buy trade should
The M5 and M15 time frames may have more false entry points.
Open chart in a new window
Double Bottom
was formed on 22.05 at 02:30:50 (UTC+0)
signal strength 3 of 5
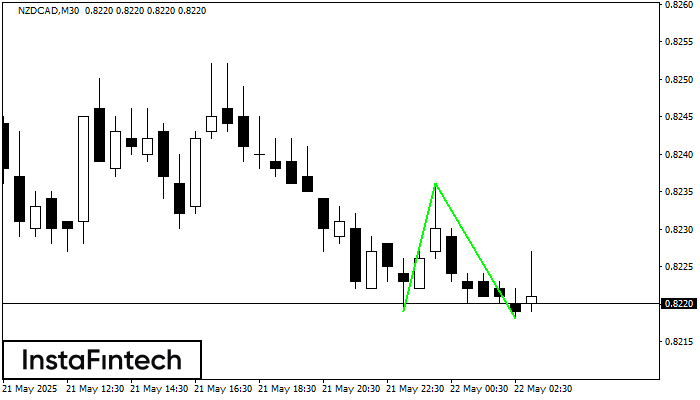
The Double Bottom pattern has been formed on NZDCAD M30. Characteristics: the support level 0.8219; the resistance level 0.8236; the width of the pattern 17 points. If the resistance level
Open chart in a new window

