

Corak sebenar

Triple Bottom
was formed on 15.04 at 20:50:28 (UTC+0)
signal strength 1 of 5
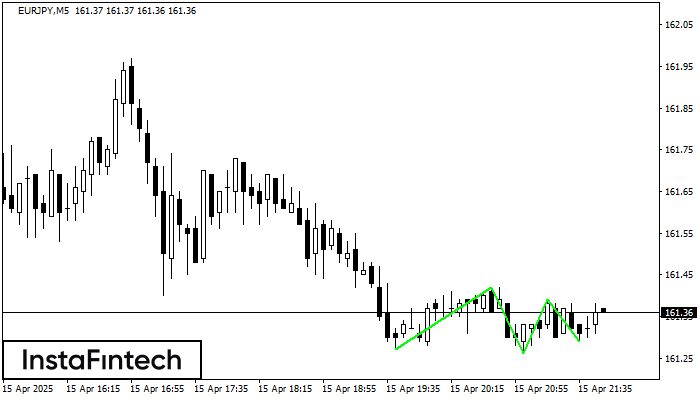
The Triple Bottom pattern has been formed on EURJPY M5. It has the following characteristics: resistance level 161.42/161.39; support level 161.27/161.29; the width is 15 points. In the event of a breakdown of the resistance level of 161.42, the price is likely to continue an upward movement at least to 161.41.
The M5 and M15 time frames may have more false entry points.
- All
- All
- Bearish Rectangle
- Bearish Symmetrical Triangle
- Bearish Symmetrical Triangle
- Bullish Rectangle
- Double Top
- Double Top
- Triple Bottom
- Triple Bottom
- Triple Top
- Triple Top
- All
- All
- Buy
- Sale
- All
- 1
- 2
- 3
- 4
- 5
Bearish pennant
сформирован 15.05 в 19:01:45 (UTC+0)
сила сигнала 3 из 5
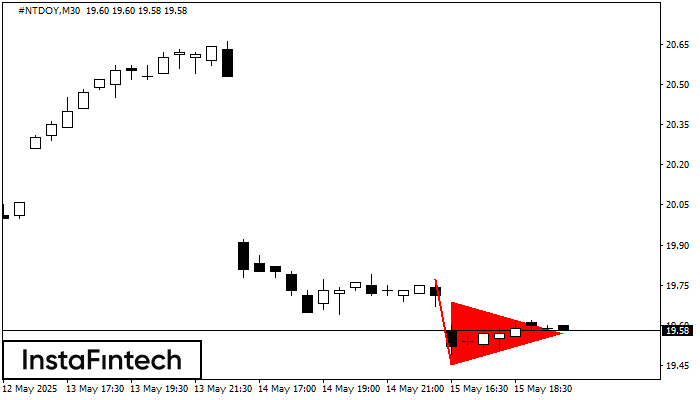
The Bearish pennant pattern has formed on the #NTDOY M30 chart. The pattern signals continuation of the downtrend in case the pennant’s low of 19.46 is broken through. Recommendations: Place
Открыть график инструмента в новом окне
Double Bottom
сформирован 15.05 в 19:01:15 (UTC+0)
сила сигнала 2 из 5
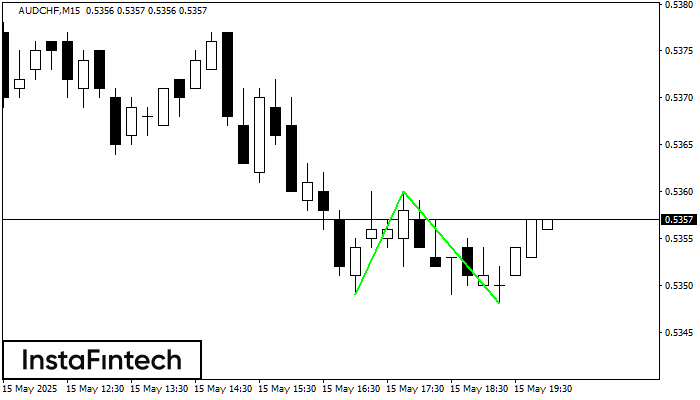
The Double Bottom pattern has been formed on AUDCHF M15. Characteristics: the support level 0.5349; the resistance level 0.5360; the width of the pattern 11 points. If the resistance level
The M5 and M15 time frames may have more false entry points.
Открыть график инструмента в новом окне
Double Top
сформирован 15.05 в 19:00:44 (UTC+0)
сила сигнала 4 из 5
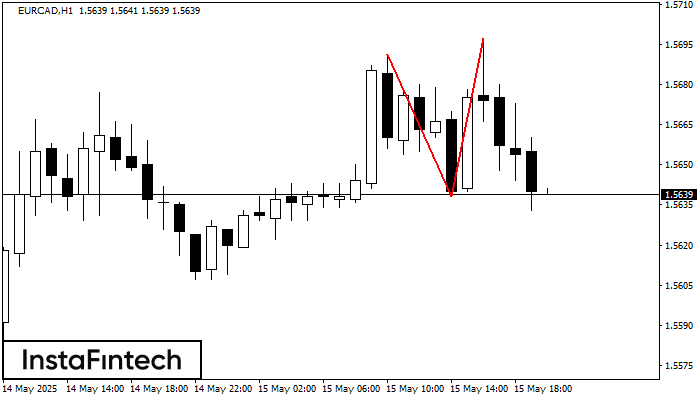
The Double Top reversal pattern has been formed on EURCAD H1. Characteristics: the upper boundary 1.5691; the lower boundary 1.5638; the width of the pattern is 59 points. Sell trades
Открыть график инструмента в новом окне


