

Corak sebenar

Double Top
was formed on 15.04 at 02:30:41 (UTC+0)
signal strength 2 of 5
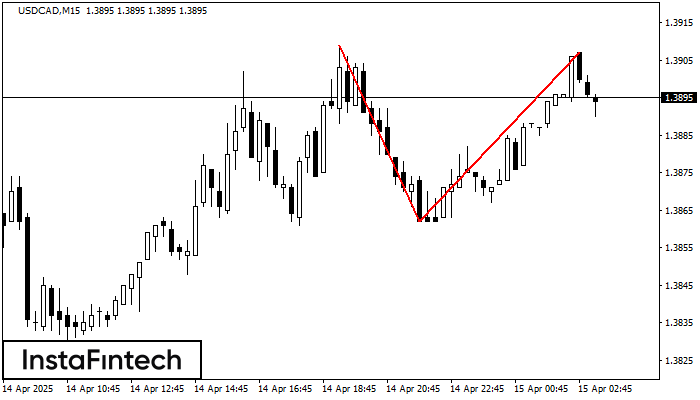
On the chart of USDCAD M15 the Double Top reversal pattern has been formed. Characteristics: the upper boundary 1.3907; the lower boundary 1.3862; the width of the pattern 45 points. The signal: a break of the lower boundary will cause continuation of the downward trend targeting the 1.3839 level.
The M5 and M15 time frames may have more false entry points.
- All
- All
- Bearish Rectangle
- Bearish Symmetrical Triangle
- Bearish Symmetrical Triangle
- Bullish Rectangle
- Double Top
- Double Top
- Triple Bottom
- Triple Bottom
- Triple Top
- Triple Top
- All
- All
- Buy
- Sale
- All
- 1
- 2
- 3
- 4
- 5
Double Top
was formed on 12.05 at 22:00:17 (UTC+0)
signal strength 3 of 5
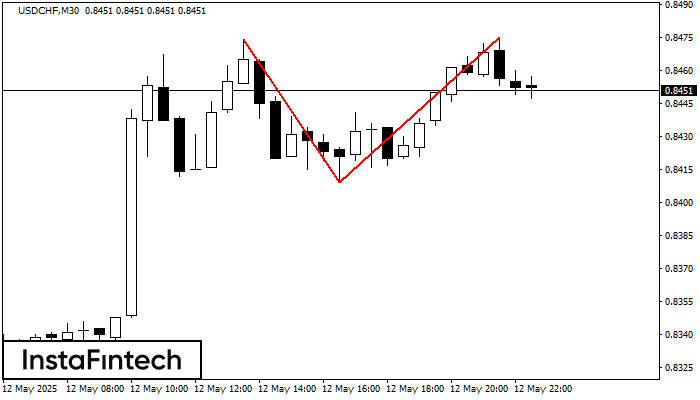
Pada carta USDCHF M30 corak pembalikan Double Top telah terbentuk. Ciri-ciri: sempadan atas 0.8475; sempadan bawah 0.8409; lebar corak 66 mata. Isyarat: penembusan sempadan bawah akan menyebabkan kesinambungan arah aliran
Open chart in a new window
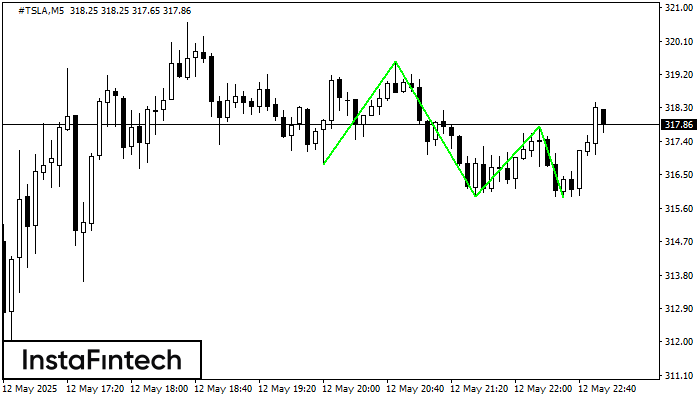
Triple Bottom
was formed on 12.05 at 21:55:25 (UTC+0)
signal strength 1 of 5

Corak Triple Bottom telah dibentuk pada #TSLA M5. Ia mempunyai ciri-ciri berikut: tahap rintangan 319.55/317.80; tahap sokongan 316.79/315.89; lebar corak adalah 276 mata. Dalam situasi penembusan paras rintangan 319.55, harga
Carta masa M5 dan M15 mungkin mempunyai lebih banyak titik kemasukan palsu.
Open chart in a new window
Triple Bottom
was formed on 12.05 at 21:55:11 (UTC+0)
signal strength 1 of 5
Corak Triple Bottom telah dibentuk pada carta #TSLA M5. Ciri-ciri corak: Garisan bawah corak mempunyai koordinat 319.55 dengan had atas 319.55/317.80, unjuran lebar adalah 276 mata. Pembentukan corak Triple Bottom
Carta masa M5 dan M15 mungkin mempunyai lebih banyak titik kemasukan palsu.
Open chart in a new window

