

Corak sebenar

Bullish Symmetrical Triangle
was formed on 15.04 at 02:04:07 (UTC+0)
signal strength 1 of 5
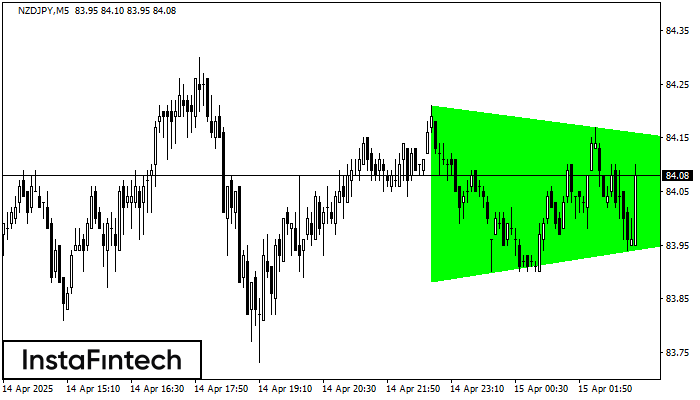
According to the chart of M5, NZDJPY formed the Bullish Symmetrical Triangle pattern. Description: This is the pattern of a trend continuation. 84.21 and 83.88 are the coordinates of the upper and lower borders respectively. The pattern width is measured on the chart at 33 pips. Outlook: If the upper border 84.21 is broken, the price is likely to continue its move by 84.21.
The M5 and M15 time frames may have more false entry points.
Juga lihat
- All
- All
- Bearish Rectangle
- Bearish Symmetrical Triangle
- Bearish Symmetrical Triangle
- Bullish Rectangle
- Double Top
- Double Top
- Triple Bottom
- Triple Bottom
- Triple Top
- Triple Top
- All
- All
- Buy
- Sale
- All
- 1
- 2
- 3
- 4
- 5
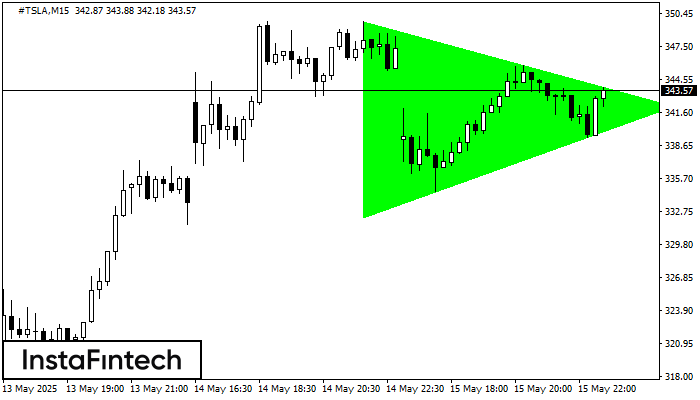
Bullish Symmetrical Triangle
сформирован 15.05 в 21:50:18 (UTC+0)
сила сигнала 2 из 5

According to the chart of M15, #TSLA formed the Bullish Symmetrical Triangle pattern. The lower border of the pattern touches the coordinates 332.24/342.17 whereas the upper border goes across 349.71/342.17
The M5 and M15 time frames may have more false entry points.
Открыть график инструмента в новом окне
Bullish Symmetrical Triangle
сформирован 15.05 в 21:50:15 (UTC+0)
сила сигнала 2 из 5
According to the chart of M15, #TSLA formed the Bullish Symmetrical Triangle pattern. The lower border of the pattern touches the coordinates 332.24/342.17 whereas the upper border goes across 349.71/342.17
The M5 and M15 time frames may have more false entry points.
Открыть график инструмента в новом окне
Double Bottom
сформирован 15.05 в 21:25:32 (UTC+0)
сила сигнала 1 из 5
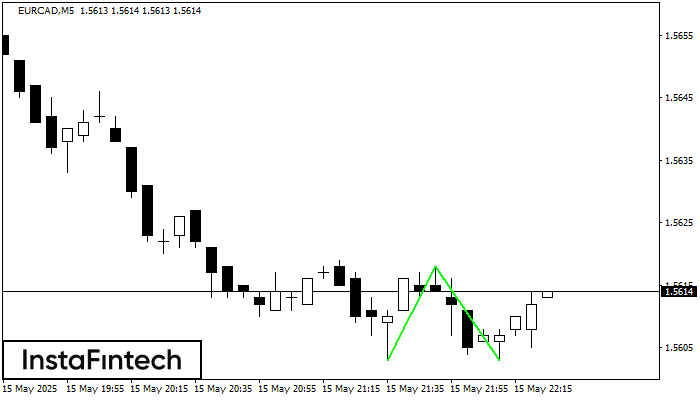
The Double Bottom pattern has been formed on EURCAD M5; the upper boundary is 1.5618; the lower boundary is 1.5603. The width of the pattern is 15 points. In case
The M5 and M15 time frames may have more false entry points.
Открыть график инструмента в новом окне


