

Corak sebenar

Triple Bottom
was formed on 15.04 at 01:15:13 (UTC+0)
signal strength 1 of 5

The Triple Bottom pattern has been formed on #Bitcoin M5. It has the following characteristics: resistance level 84720.65/84653.62; support level 84401.53/84425.81; the width is 31912 points. In the event of a breakdown of the resistance level of 84720.65, the price is likely to continue an upward movement at least to 84378.00.
The M5 and M15 time frames may have more false entry points.
- All
- All
- Bearish Rectangle
- Bearish Symmetrical Triangle
- Bearish Symmetrical Triangle
- Bullish Rectangle
- Double Top
- Double Top
- Triple Bottom
- Triple Bottom
- Triple Top
- Triple Top
- All
- All
- Buy
- Sale
- All
- 1
- 2
- 3
- 4
- 5
Triple Top
сформирован 16.05 в 02:15:29 (UTC+0)
сила сигнала 2 из 5

The Triple Top pattern has formed on the chart of the GBPAUD M15. Features of the pattern: borders have an ascending angle; the lower line of the pattern
The M5 and M15 time frames may have more false entry points.
Открыть график инструмента в новом окне
Double Bottom
сформирован 16.05 в 02:00:31 (UTC+0)
сила сигнала 3 из 5
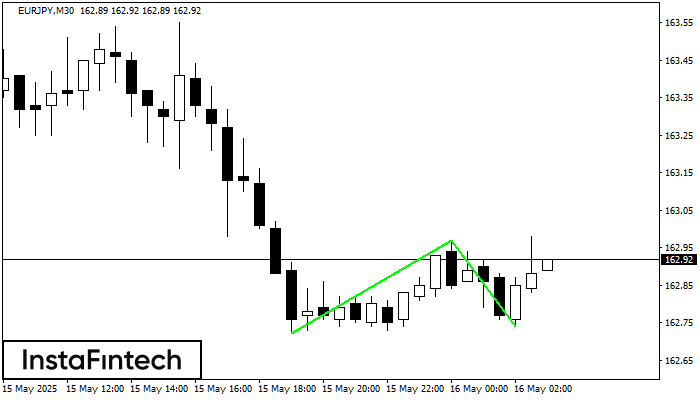
The Double Bottom pattern has been formed on EURJPY M30. This formation signals a reversal of the trend from downwards to upwards. The signal is that a buy trade should
Открыть график инструмента в новом окне
Double Bottom
сформирован 16.05 в 01:45:15 (UTC+0)
сила сигнала 2 из 5
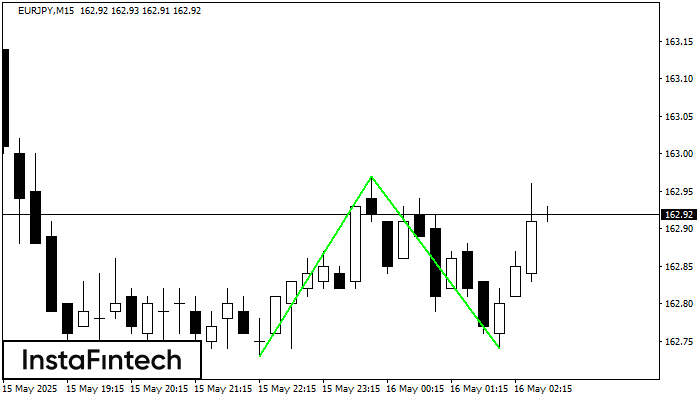
The Double Bottom pattern has been formed on EURJPY M15. Characteristics: the support level 162.73; the resistance level 162.97; the width of the pattern 24 points. If the resistance level
The M5 and M15 time frames may have more false entry points.
Открыть график инструмента в новом окне

