

Corak sebenar

Bullish Rectangle
was formed on 14.04 at 19:23:06 (UTC+0)
signal strength 3 of 5
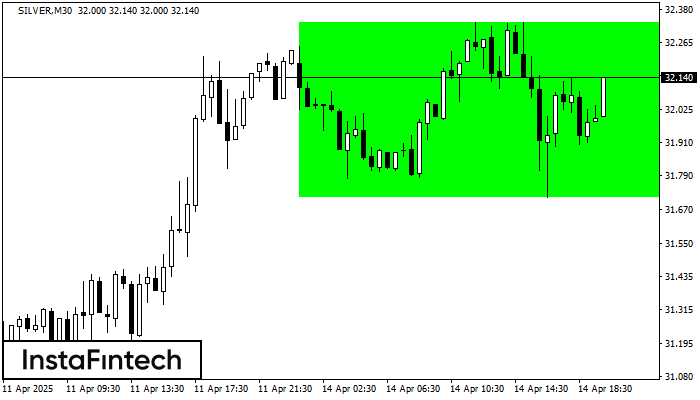
According to the chart of M30, SILVER formed the Bullish Rectangle. The pattern indicates a trend continuation. The upper border is 32.34, the lower border is 31.71. The signal means that a long position should be opened above the upper border 32.34 of the Bullish Rectangle.
- All
- All
- Bearish Rectangle
- Bearish Symmetrical Triangle
- Bearish Symmetrical Triangle
- Bullish Rectangle
- Double Top
- Double Top
- Triple Bottom
- Triple Bottom
- Triple Top
- Triple Top
- All
- All
- Buy
- Sale
- All
- 1
- 2
- 3
- 4
- 5
Double Bottom
was formed on 30.05 at 17:00:32 (UTC+0)
signal strength 4 of 5
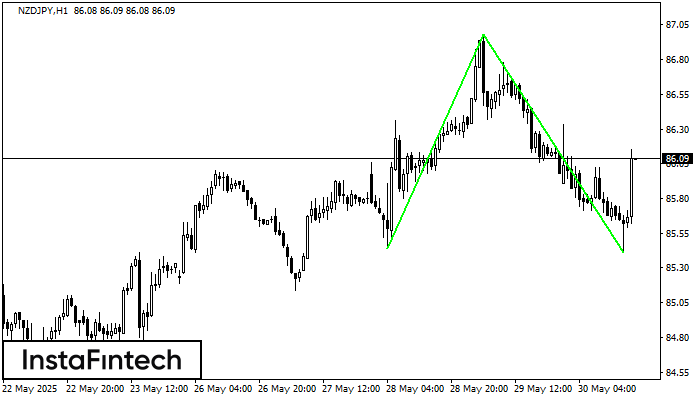
The Double Bottom pattern has been formed on NZDJPY H1; the upper boundary is 86.98; the lower boundary is 85.41. The width of the pattern is 154 points. In case
Open chart in a new window
Double Bottom
was formed on 30.05 at 17:00:20 (UTC+0)
signal strength 2 of 5
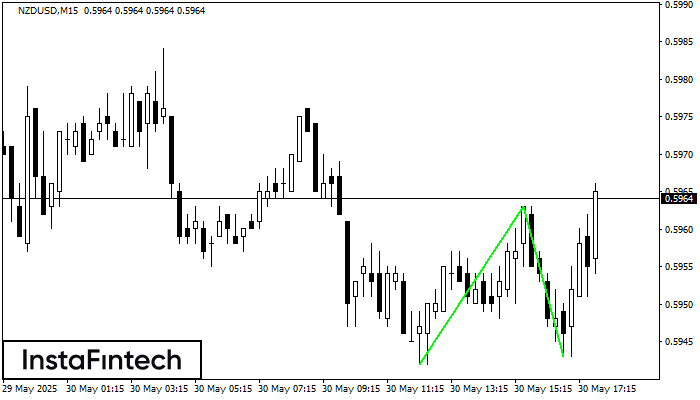
The Double Bottom pattern has been formed on NZDUSD M15. This formation signals a reversal of the trend from downwards to upwards. The signal is that a buy trade should
The M5 and M15 time frames may have more false entry points.
Open chart in a new window
Double Bottom
was formed on 30.05 at 17:00:11 (UTC+0)
signal strength 4 of 5
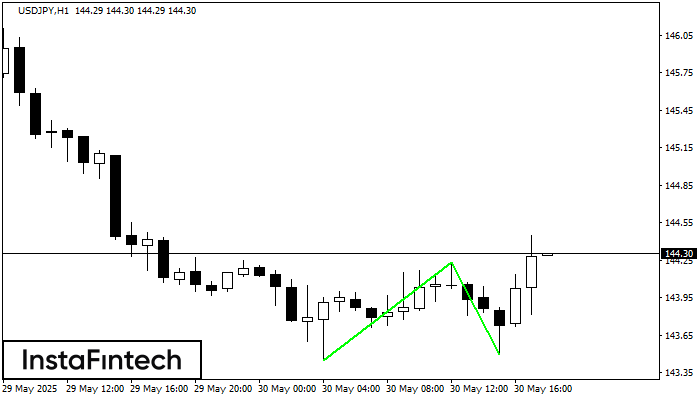
The Double Bottom pattern has been formed on USDJPY H1; the upper boundary is 144.23; the lower boundary is 143.50. The width of the pattern is 78 points. In case
Open chart in a new window


