

Corak sebenar

Triple Top
was formed on 14.04 at 16:00:26 (UTC+0)
signal strength 4 of 5

The Triple Top pattern has formed on the chart of the EURJPY H1. Features of the pattern: borders have an ascending angle; the lower line of the pattern has the coordinates 161.49/162.07 with the upper limit 163.10/163.14; the projection of the width is 161 points. The formation of the Triple Top figure most likely indicates a change in the trend from upward to downward. This means that in the event of a breakdown of the support level of 161.49, the price is most likely to continue the downward movement.
- All
- All
- Bearish Rectangle
- Bearish Symmetrical Triangle
- Bearish Symmetrical Triangle
- Bullish Rectangle
- Double Top
- Double Top
- Triple Bottom
- Triple Bottom
- Triple Top
- Triple Top
- All
- All
- Buy
- Sale
- All
- 1
- 2
- 3
- 4
- 5
Double Top
was formed on 16.05 at 15:40:56 (UTC+0)
signal strength 1 of 5
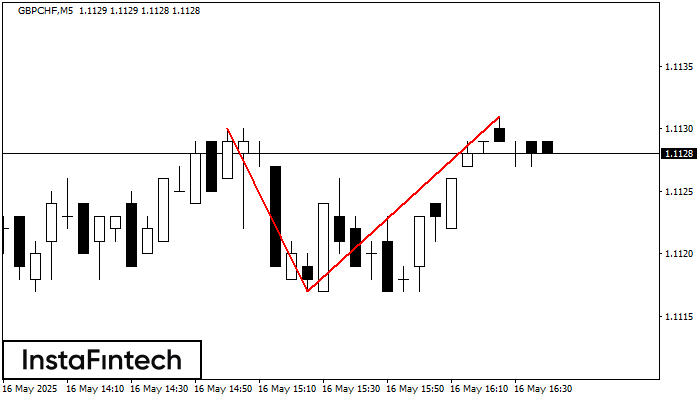
Corak Double Top telah dibentuk pada GBPCHF M5. Isyarat bahawa aliran telah berubah dari aliran menaik ke aliran menurun. Mungkin, sekiranya asas corak 1.1117 ditembusi, pergerakan menurun akan berterusan
Carta masa M5 dan M15 mungkin mempunyai lebih banyak titik kemasukan palsu.
Open chart in a new window
Segi Tiga Simetri Menaik
was formed on 16.05 at 15:30:47 (UTC+0)
signal strength 3 of 5
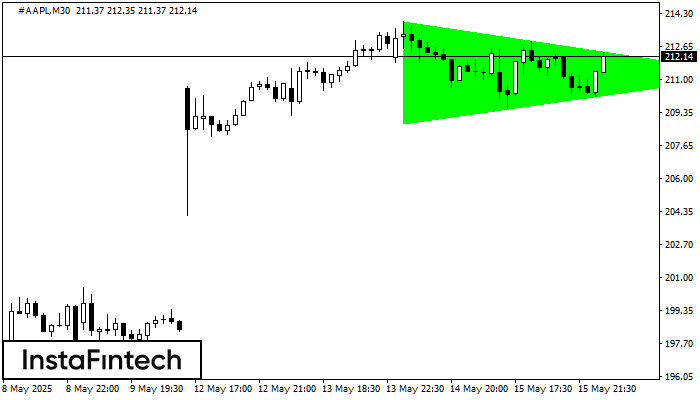
Berdasarkan carta M30, #AAPL membentuk corak Segi Tiga Simetri Menaik. Sempadan yang lebih rendah bagi corak yang menyentuh koordinat 208.80/211.23 di mana sempadan atas merentasi 213.91/211.23. Sekiranya corak Segi Tiga
Open chart in a new window
Inverse Head dan Shoulder
was formed on 16.05 at 15:30:27 (UTC+0)
signal strength 3 of 5
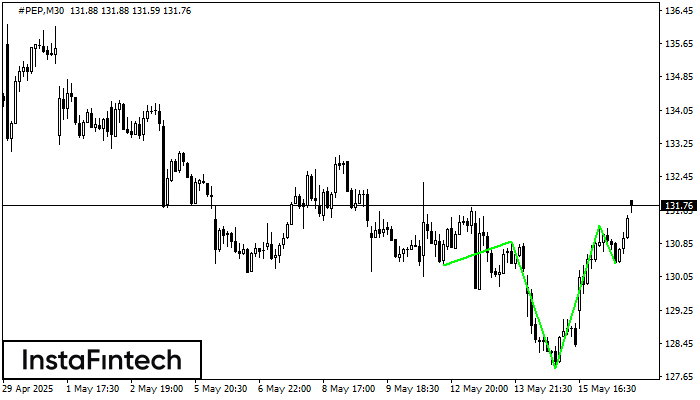
According to M30, #PEP is shaping the technical pattern – the Inverse Head dan Shoulder. In case the Neckline 130.89/131.28 is broken out, the instrument is likely to move toward
Open chart in a new window


