

Corak sebenar

Double Top
was formed on 14.04 at 00:45:17 (UTC+0)
signal strength 2 of 5

The Double Top pattern has been formed on AUDCAD M15. It signals that the trend has been changed from upwards to downwards. Probably, if the base of the pattern 0.8713 is broken, the downward movement will continue.
The M5 and M15 time frames may have more false entry points.
- All
- All
- Bearish Rectangle
- Bearish Symmetrical Triangle
- Bearish Symmetrical Triangle
- Bullish Rectangle
- Double Top
- Double Top
- Triple Bottom
- Triple Bottom
- Triple Top
- Triple Top
- All
- All
- Buy
- Sale
- All
- 1
- 2
- 3
- 4
- 5
Triple Top
сформирован 21.05 в 00:15:24 (UTC+0)
сила сигнала 2 из 5
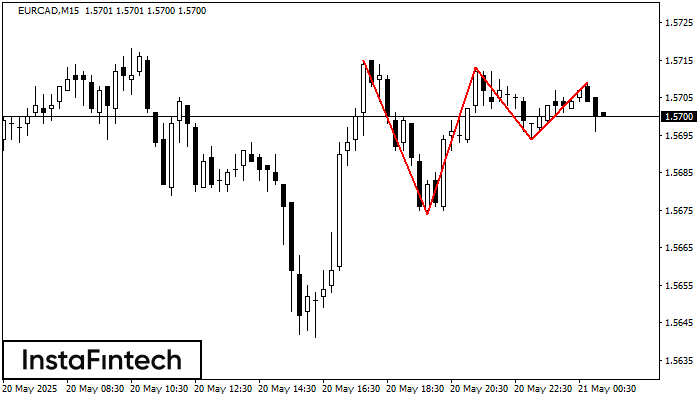
On the chart of the EURCAD M15 trading instrument, the Triple Top pattern that signals a trend change has formed. It is possible that after formation of the third peak
The M5 and M15 time frames may have more false entry points.
Открыть график инструмента в новом окне
Bearish Rectangle
сформирован 20.05 в 23:35:46 (UTC+0)
сила сигнала 1 из 5
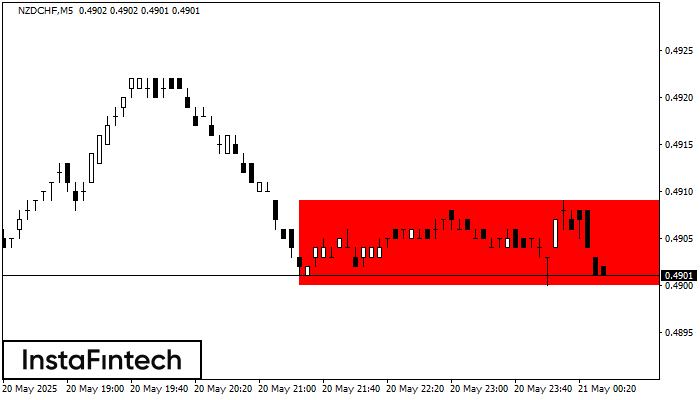
According to the chart of M5, NZDCHF formed the Bearish Rectangle. The pattern indicates a trend continuation. The upper border is 0.4909, the lower border is 0.4900. The signal means
The M5 and M15 time frames may have more false entry points.
Открыть график инструмента в новом окне
Bearish Rectangle
сформирован 20.05 в 23:31:16 (UTC+0)
сила сигнала 1 из 5
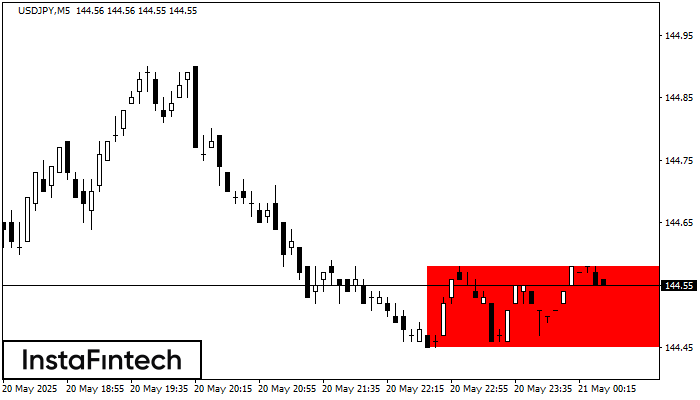
According to the chart of M5, USDJPY formed the Bearish Rectangle. The pattern indicates a trend continuation. The upper border is 144.58, the lower border is 144.45. The signal means
The M5 and M15 time frames may have more false entry points.
Открыть график инструмента в новом окне


