

Corak sebenar

Bullish Rectangle
was formed on 14.04 at 00:42:49 (UTC+0)
signal strength 1 of 5
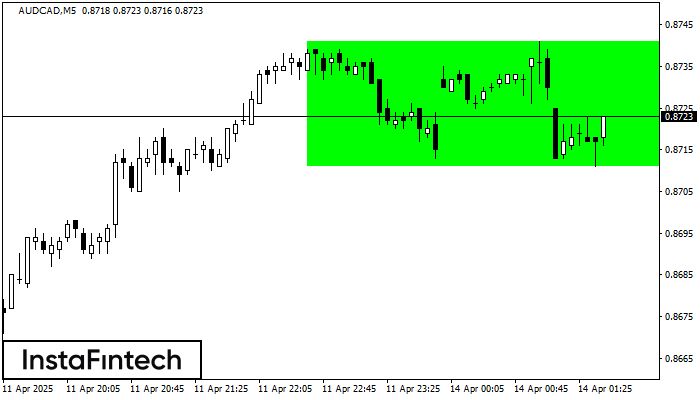
According to the chart of M5, AUDCAD formed the Bullish Rectangle which is a pattern of a trend continuation. The pattern is contained within the following borders: the lower border 0.8711 – 0.8711 and upper border 0.8741 – 0.8741. In case the upper border is broken, the instrument is likely to follow the upward trend.
The M5 and M15 time frames may have more false entry points.
Juga lihat
- All
- All
- Bearish Rectangle
- Bearish Symmetrical Triangle
- Bearish Symmetrical Triangle
- Bullish Rectangle
- Double Top
- Double Top
- Triple Bottom
- Triple Bottom
- Triple Top
- Triple Top
- All
- All
- Buy
- Sale
- All
- 1
- 2
- 3
- 4
- 5
Double Bottom
was formed on 22.05 at 10:30:10 (UTC+0)
signal strength 3 of 5
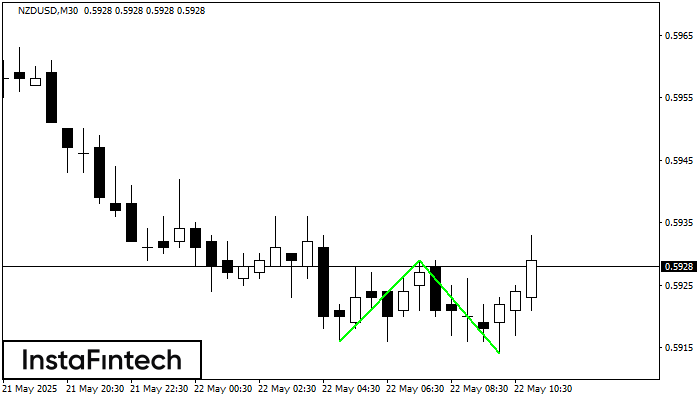
Corak Double Bottom telah dibentuk pada NZDUSD M30. Ciri-ciri: tahap sokongan 0.5916; tahap rintangan 0.5929; lebar corak 13 mata. Sekiranya tahap rintangan ditembusi, perubahan aliran boleh diramalkan dengan titik sasaran
Open chart in a new window
Double Bottom
was formed on 22.05 at 10:30:07 (UTC+0)
signal strength 2 of 5
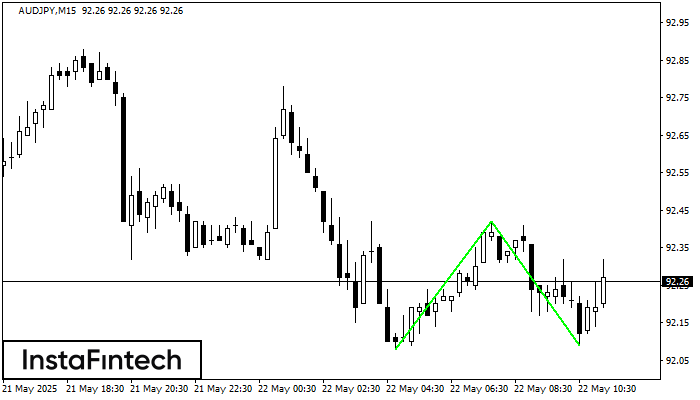
Corak Double Bottom telah dibentuk pada AUDJPY M15. Ciri-ciri: tahap sokongan 92.08; tahap rintangan 92.42; lebar corak 34 mata. Sekiranya tahap rintangan ditembusi, perubahan aliran boleh diramalkan dengan titik sasaran
Carta masa M5 dan M15 mungkin mempunyai lebih banyak titik kemasukan palsu.
Open chart in a new window
Double Bottom
was formed on 22.05 at 10:25:09 (UTC+0)
signal strength 1 of 5
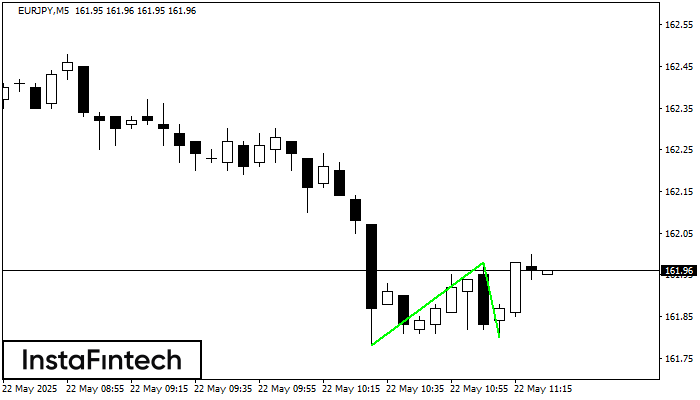
Corak Double Bottom telah dibentuk pada EURJPY M5. Ciri-ciri: tahap sokongan 161.78; tahap rintangan 161.98; lebar corak 20 mata. Sekiranya tahap rintangan ditembusi, perubahan aliran boleh diramalkan dengan titik sasaran
Carta masa M5 dan M15 mungkin mempunyai lebih banyak titik kemasukan palsu.
Open chart in a new window


