

Corak sebenar

Triple Top
was formed on 09.04 at 11:34:58 (UTC+0)
signal strength 1 of 5

On the chart of the NZDUSD M5 trading instrument, the Triple Top pattern that signals a trend change has formed. It is possible that after formation of the third peak, the price will try to break through the resistance level 0.5542, where we advise to open a trading position for sale. Take profit is the projection of the pattern’s width, which is 16 points.
The M5 and M15 time frames may have more false entry points.
Juga lihat
- All
- All
- Bearish Rectangle
- Bearish Symmetrical Triangle
- Bearish Symmetrical Triangle
- Bullish Rectangle
- Double Top
- Double Top
- Triple Bottom
- Triple Bottom
- Triple Top
- Triple Top
- All
- All
- Buy
- Sale
- All
- 1
- 2
- 3
- 4
- 5
Triple Bottom
was formed on 07.05 at 23:25:32 (UTC+0)
signal strength 1 of 5
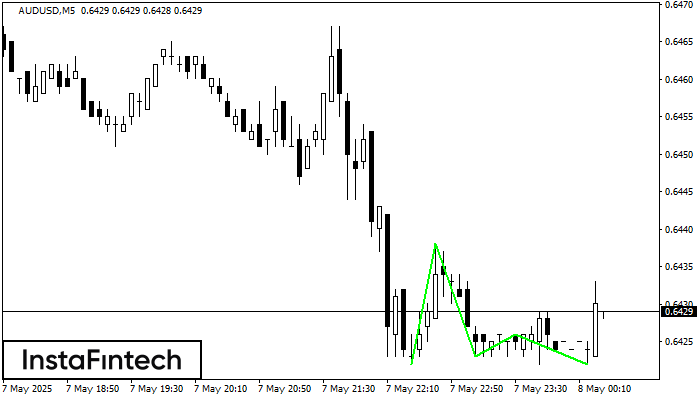
Corak Triple Bottom telah dibentuk pada carta AUDUSD M5. Ciri-ciri corak: Garisan bawah corak mempunyai koordinat 0.6438 dengan had atas 0.6438/0.6426, unjuran lebar adalah 16 mata. Pembentukan corak Triple Bottom
Carta masa M5 dan M15 mungkin mempunyai lebih banyak titik kemasukan palsu.
Open chart in a new window
Double Bottom
was formed on 07.05 at 23:15:23 (UTC+0)
signal strength 2 of 5
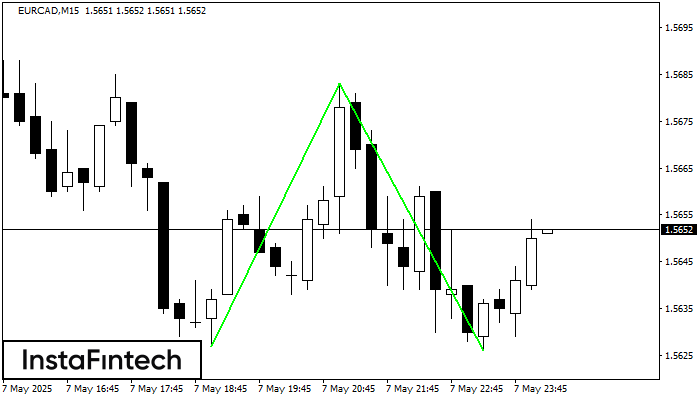
Corak Double Bottom telah dibentuk pada EURCAD M15; sempadan atas adalah 1.5683; sempadan bawah adalah 1.5626. Lebar corak adalah 56 mata. Sekiranya penembusan sempadan atas 1.5683, perubahan aliran boleh diramalkan
Carta masa M5 dan M15 mungkin mempunyai lebih banyak titik kemasukan palsu.
Open chart in a new window
Double Bottom
was formed on 07.05 at 22:31:29 (UTC+0)
signal strength 1 of 5
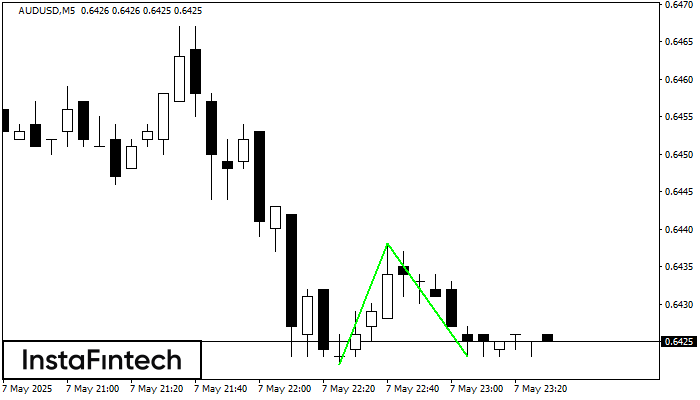
Corak Double Bottom telah dibentuk pada AUDUSD M5. Ciri-ciri: tahap sokongan 0.6422; tahap rintangan 0.6438; lebar corak 16 mata. Sekiranya tahap rintangan ditembusi, perubahan aliran boleh diramalkan dengan titik sasaran
Carta masa M5 dan M15 mungkin mempunyai lebih banyak titik kemasukan palsu.
Open chart in a new window


