

Corak sebenar

Double Top
was formed on 09.04 at 08:15:06 (UTC+0)
signal strength 2 of 5
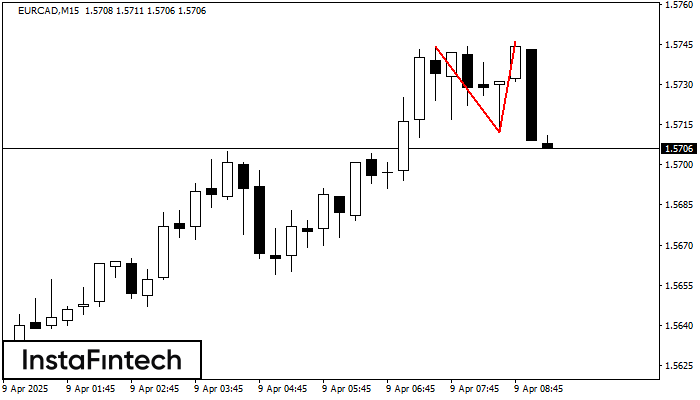
On the chart of EURCAD M15 the Double Top reversal pattern has been formed. Characteristics: the upper boundary 1.5746; the lower boundary 1.5712; the width of the pattern 34 points. The signal: a break of the lower boundary will cause continuation of the downward trend targeting the 1.5690 level.
The M5 and M15 time frames may have more false entry points.
- All
- All
- Bearish Rectangle
- Bearish Symmetrical Triangle
- Bearish Symmetrical Triangle
- Bullish Rectangle
- Double Top
- Double Top
- Triple Bottom
- Triple Bottom
- Triple Top
- Triple Top
- All
- All
- Buy
- Sale
- All
- 1
- 2
- 3
- 4
- 5
Bearish Rectangle
was formed on 07.05 at 20:07:22 (UTC+0)
signal strength 5 of 5
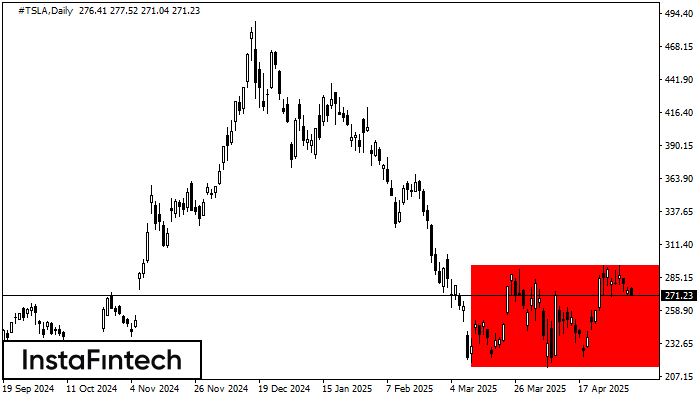
According to the chart of D1, #TSLA formed the Bearish Rectangle. This type of a pattern indicates a trend continuation. It consists of two levels: resistance 294.59 - 0.00
Open chart in a new window
Bearish Rectangle
was formed on 07.05 at 20:07:13 (UTC+0)
signal strength 5 of 5

According to the chart of D1, #TSLA formed the Bearish Rectangle which is a pattern of a trend continuation. The pattern is contained within the following borders: lower border 214.10
Open chart in a new window
Triple Bottom
was formed on 07.05 at 20:05:50 (UTC+0)
signal strength 1 of 5
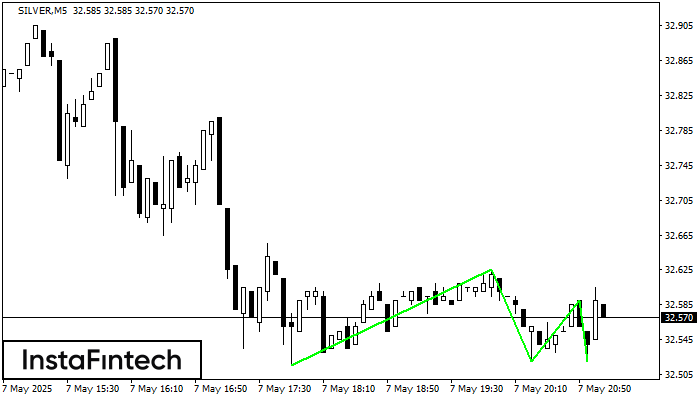
The Triple Bottom pattern has been formed on SILVER M5. It has the following characteristics: resistance level 32.62/32.59; support level 32.52/32.52; the width is 110 points. In the event
The M5 and M15 time frames may have more false entry points.
Open chart in a new window


