

Corak sebenar

Triple Top
was formed on 08.04 at 05:00:22 (UTC+0)
signal strength 1 of 5
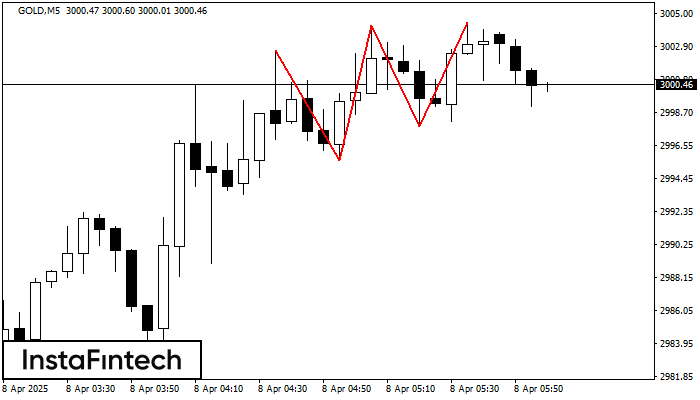
On the chart of the GOLD M5 trading instrument, the Triple Top pattern that signals a trend change has formed. It is possible that after formation of the third peak, the price will try to break through the resistance level 2995.63, where we advise to open a trading position for sale. Take profit is the projection of the pattern’s width, which is 701 points.
The M5 and M15 time frames may have more false entry points.
- All
- All
- Bearish Rectangle
- Bearish Symmetrical Triangle
- Bearish Symmetrical Triangle
- Bullish Rectangle
- Double Top
- Double Top
- Triple Bottom
- Triple Bottom
- Triple Top
- Triple Top
- All
- All
- Buy
- Sale
- All
- 1
- 2
- 3
- 4
- 5
Double Bottom
was formed on 12.05 at 10:55:51 (UTC+0)
signal strength 1 of 5
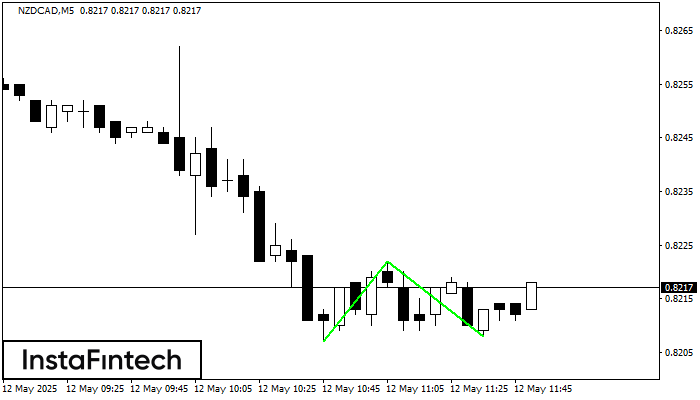
Corak Double Bottom telah dibentuk pada NZDCAD M5. Ciri-ciri: tahap sokongan 0.8207; tahap rintangan 0.8222; lebar corak 15 mata. Sekiranya tahap rintangan ditembusi, perubahan aliran boleh diramalkan dengan titik sasaran
Carta masa M5 dan M15 mungkin mempunyai lebih banyak titik kemasukan palsu.
Open chart in a new window
Double Bottom
was formed on 12.05 at 10:25:18 (UTC+0)
signal strength 1 of 5
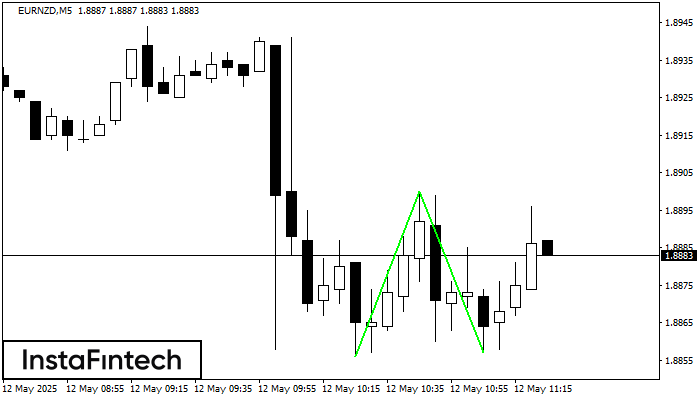
Corak Double Bottom telah dibentuk pada EURNZD M5. Pembentukan ini menandakan pembalikan aliran dari aliran menurun ke atas. Isyarat ialah perdagangan membeli harus dibuka selepas sempadan atas corak 1.8900 telah
Carta masa M5 dan M15 mungkin mempunyai lebih banyak titik kemasukan palsu.
Open chart in a new window
Segi Tiga Simetri Menaik
was formed on 12.05 at 08:39:25 (UTC+0)
signal strength 1 of 5
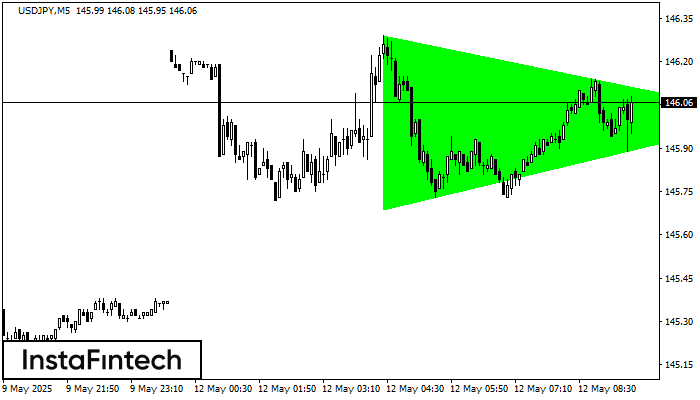
Berdasarkan carta M5, USDJPY membentuk corak Segi Tiga Simetri Menaik. Sempadan yang lebih rendah bagi corak yang menyentuh koordinat 145.69/146.01 di mana sempadan atas merentasi 146.29/146.01. Sekiranya corak Segi Tiga
Carta masa M5 dan M15 mungkin mempunyai lebih banyak titik kemasukan palsu.
Open chart in a new window

