

Corak sebenar

Triple Top
was formed on 08.04 at 01:40:24 (UTC+0)
signal strength 1 of 5
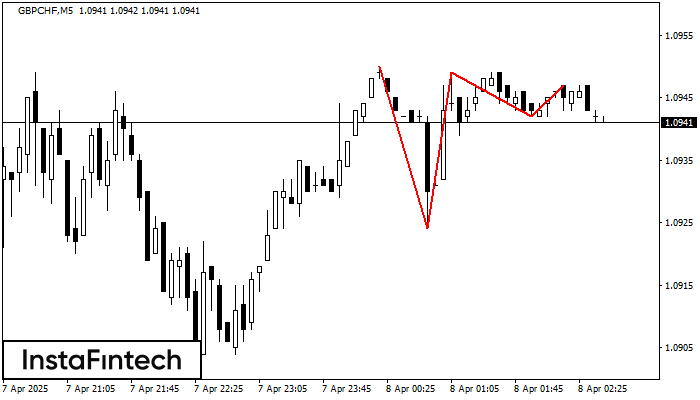
On the chart of the GBPCHF M5 trading instrument, the Triple Top pattern that signals a trend change has formed. It is possible that after formation of the third peak, the price will try to break through the resistance level 1.0924, where we advise to open a trading position for sale. Take profit is the projection of the pattern’s width, which is 26 points.
The M5 and M15 time frames may have more false entry points.
- All
- All
- Bearish Rectangle
- Bearish Symmetrical Triangle
- Bearish Symmetrical Triangle
- Bullish Rectangle
- Double Top
- Double Top
- Triple Bottom
- Triple Bottom
- Triple Top
- Triple Top
- All
- All
- Buy
- Sale
- All
- 1
- 2
- 3
- 4
- 5
Bullish Symmetrical Triangle
сформирован 22.05 в 02:03:55 (UTC+0)
сила сигнала 1 из 5
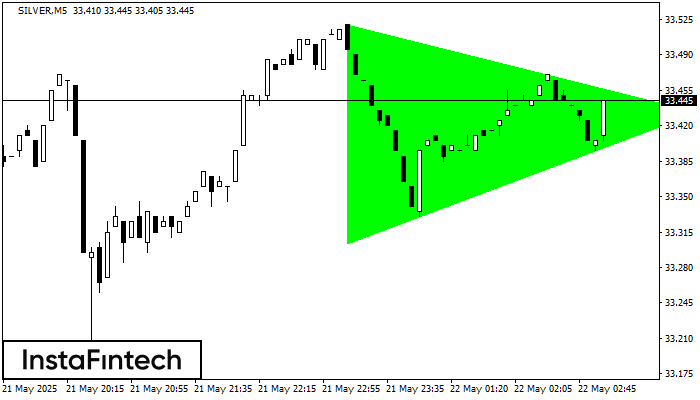
According to the chart of M5, SILVER formed the Bullish Symmetrical Triangle pattern, which signals the trend will continue. Description. The upper border of the pattern touches the coordinates 33.52/33.43
The M5 and M15 time frames may have more false entry points.
Открыть график инструмента в новом окне
Bullish Symmetrical Triangle
сформирован 22.05 в 02:03:10 (UTC+0)
сила сигнала 4 из 5
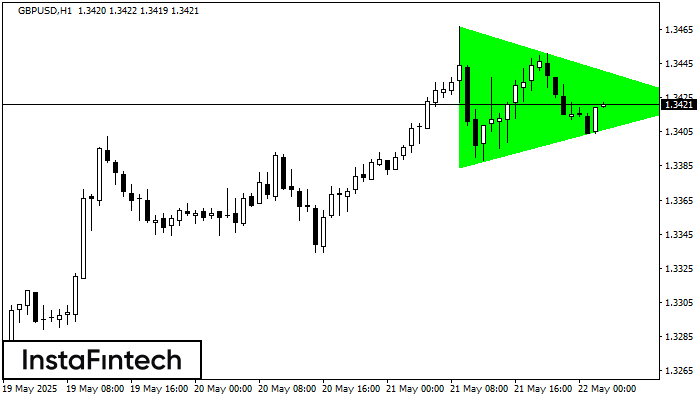
According to the chart of H1, GBPUSD formed the Bullish Symmetrical Triangle pattern. Description: This is the pattern of a trend continuation. 1.3467 and 1.3384 are the coordinates
Открыть график инструмента в новом окне
Triple Bottom
сформирован 22.05 в 02:00:46 (UTC+0)
сила сигнала 2 из 5
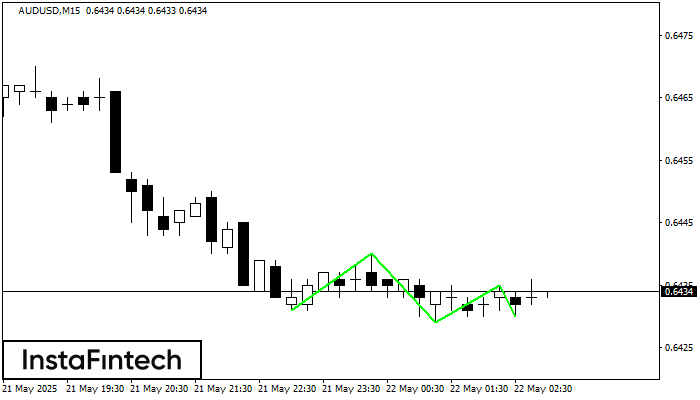
The Triple Bottom pattern has been formed on AUDUSD M15. It has the following characteristics: resistance level 0.6440/0.6435; support level 0.6431/0.6430; the width is 9 points. In the event
The M5 and M15 time frames may have more false entry points.
Открыть график инструмента в новом окне

