

Corak sebenar

Bullish Symmetrical Triangle
was formed on 05.04 at 06:31:21 (UTC+0)
signal strength 2 of 5

According to the chart of M15, #Bitcoin formed the Bullish Symmetrical Triangle pattern. The lower border of the pattern touches the coordinates 83167.44/83888.94 whereas the upper border goes across 84422.11/83888.94. If the Bullish Symmetrical Triangle pattern is in progress, this evidently signals a further upward trend. In other words, in case the scenario comes true, the price of #Bitcoin will breach the upper border to head for 83889.16.
The M5 and M15 time frames may have more false entry points.
- All
- All
- Bearish Rectangle
- Bearish Symmetrical Triangle
- Bearish Symmetrical Triangle
- Bullish Rectangle
- Double Top
- Double Top
- Triple Bottom
- Triple Bottom
- Triple Top
- Triple Top
- All
- All
- Buy
- Sale
- All
- 1
- 2
- 3
- 4
- 5
Double Bottom
was formed on 15.04 at 14:40:16 (UTC+0)
signal strength 1 of 5
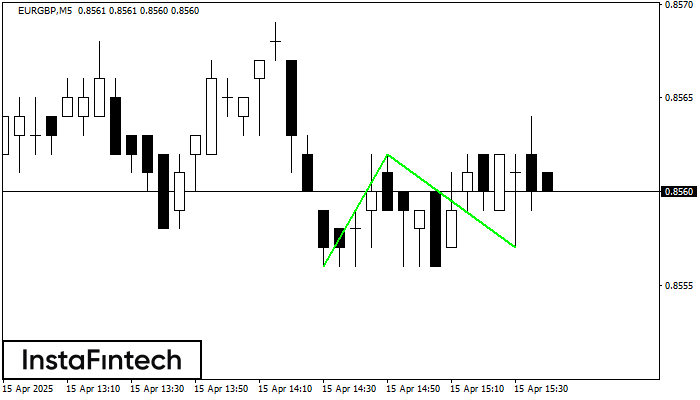
Corak Double Bottom telah dibentuk pada EURGBP M5. Pembentukan ini menandakan pembalikan aliran dari aliran menurun ke atas. Isyarat ialah perdagangan membeli harus dibuka selepas sempadan atas corak 0.8562 telah
Carta masa M5 dan M15 mungkin mempunyai lebih banyak titik kemasukan palsu.
Open chart in a new window
Double Bottom
was formed on 15.04 at 14:04:52 (UTC+0)
signal strength 1 of 5
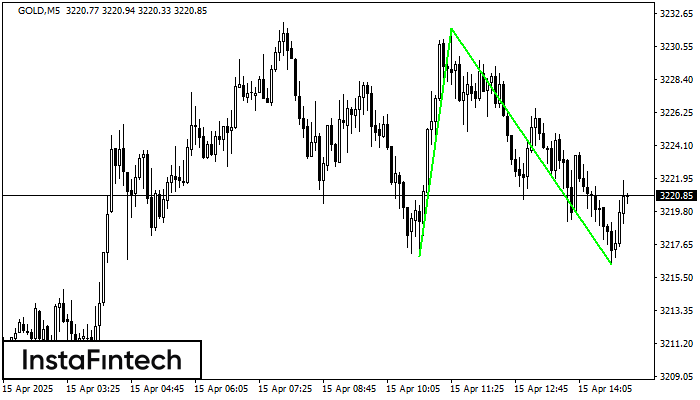
Corak Double Bottom telah dibentuk pada GOLD M5. Pembentukan ini menandakan pembalikan aliran dari aliran menurun ke atas. Isyarat ialah perdagangan membeli harus dibuka selepas sempadan atas corak 3231.69 telah
Carta masa M5 dan M15 mungkin mempunyai lebih banyak titik kemasukan palsu.
Open chart in a new window
Double Top
was formed on 15.04 at 14:00:31 (UTC+0)
signal strength 4 of 5
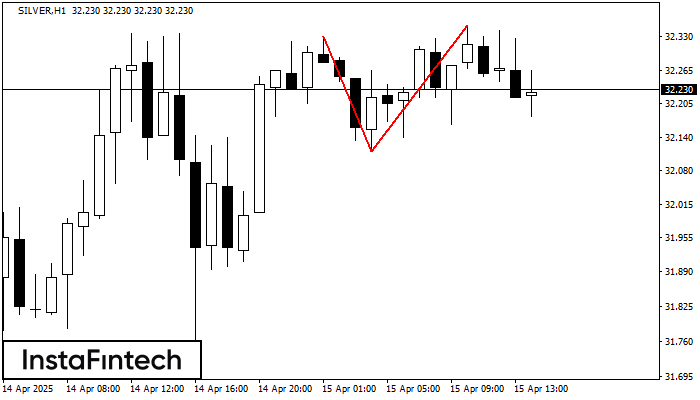
Corak Double Top telah dibentuk pada SILVER H1. Isyarat bahawa aliran telah berubah dari aliran menaik ke aliran menurun. Mungkin, sekiranya asas corak 32.12 ditembusi, pergerakan menurun akan berterusan
Open chart in a new window


