

Corak sebenar

Double Bottom
was formed on 04.04 at 21:45:36 (UTC+0)
signal strength 2 of 5
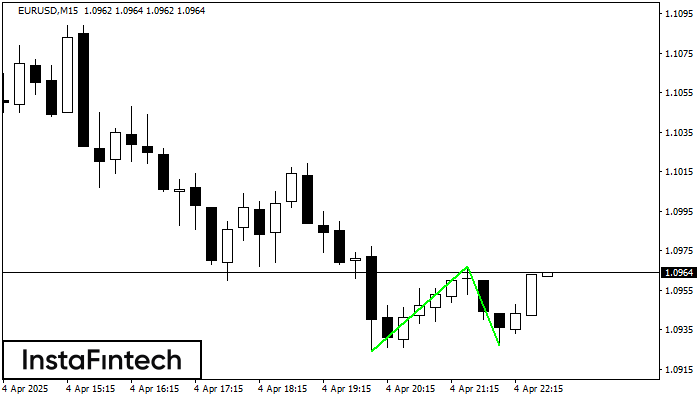
The Double Bottom pattern has been formed on EURUSD M15; the upper boundary is 1.0967; the lower boundary is 1.0927. The width of the pattern is 43 points. In case of a break of the upper boundary 1.0967, a change in the trend can be predicted where the width of the pattern will coincide with the distance to a possible take profit level.
The M5 and M15 time frames may have more false entry points.
- All
- All
- Bearish Rectangle
- Bearish Symmetrical Triangle
- Bearish Symmetrical Triangle
- Bullish Rectangle
- Double Top
- Double Top
- Triple Bottom
- Triple Bottom
- Triple Top
- Triple Top
- All
- All
- Buy
- Sale
- All
- 1
- 2
- 3
- 4
- 5
Bullish Rectangle
was formed on 23.05 at 21:05:12 (UTC+0)
signal strength 1 of 5
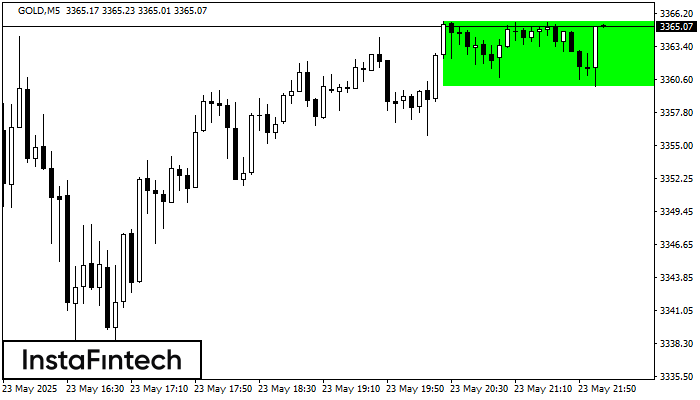
According to the chart of M5, GOLD formed the Bullish Rectangle which is a pattern of a trend continuation. The pattern is contained within the following borders: the lower border
The M5 and M15 time frames may have more false entry points.
Open chart in a new window
Triple Bottom
was formed on 23.05 at 21:00:18 (UTC+0)
signal strength 1 of 5
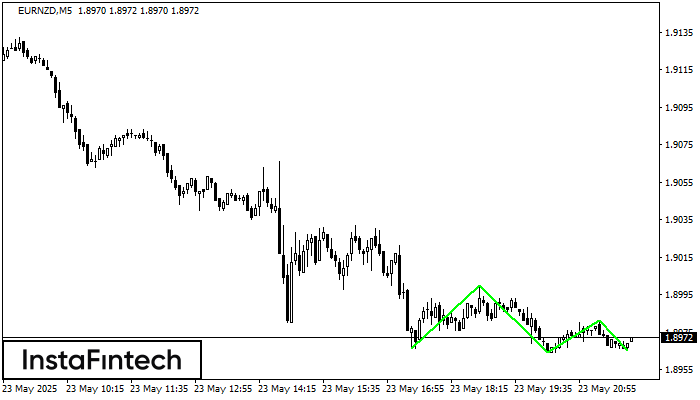
The Triple Bottom pattern has formed on the chart of EURNZD M5. Features of the pattern: The lower line of the pattern has coordinates 1.9000 with the upper limit 1.9000/1.8981
The M5 and M15 time frames may have more false entry points.
Open chart in a new window
Double Top
was formed on 23.05 at 21:00:10 (UTC+0)
signal strength 2 of 5
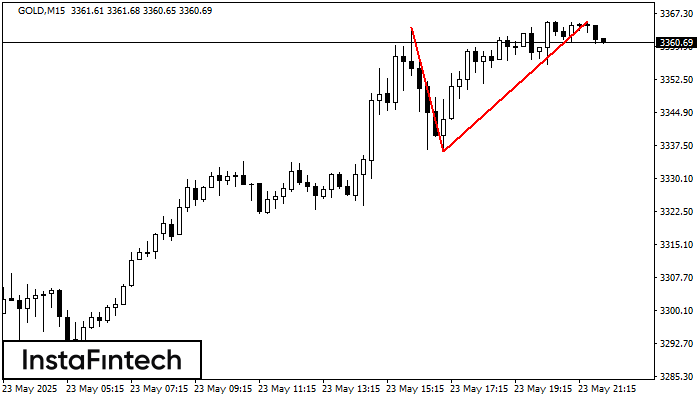
The Double Top reversal pattern has been formed on GOLD M15. Characteristics: the upper boundary 3364.24; the lower boundary 3336.09; the width of the pattern is 2936 points. Sell trades
The M5 and M15 time frames may have more false entry points.
Open chart in a new window


