

Corak sebenar

Bearish pennant
was formed on 03.04 at 20:01:45 (UTC+0)
signal strength 4 of 5
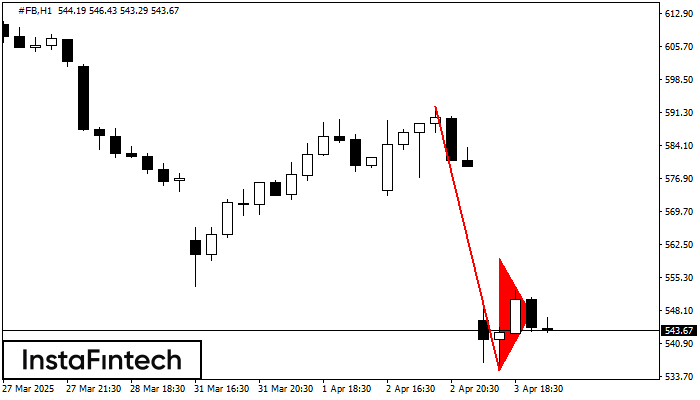
The Bearish pennant pattern has formed on the #FB H1 chart. The pattern signals continuation of the downtrend in case the pennant’s low of 535.05 is broken through. Recommendations: Place the sell stop pending order 10 pips below the pattern’s low. Place the take profit order at the projection distance of the flagpole height.
- All
- All
- Bearish Rectangle
- Bearish Symmetrical Triangle
- Bearish Symmetrical Triangle
- Bullish Rectangle
- Double Top
- Double Top
- Triple Bottom
- Triple Bottom
- Triple Top
- Triple Top
- All
- All
- Buy
- Sale
- All
- 1
- 2
- 3
- 4
- 5
Bearish Flag
was formed on 11.05 at 23:51:00 (UTC+0)
signal strength 2 of 5
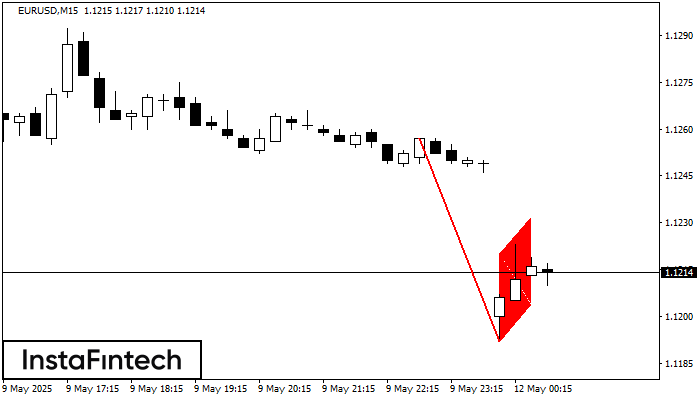
The Bearish Flag pattern has been formed on the chart EURUSD M15 which signals that the downward trend will continue. If the price breaks below the low at 1.1192, then
The M5 and M15 time frames may have more false entry points.
Open chart in a new window
Bullish Rectangle
was formed on 11.05 at 23:32:05 (UTC+0)
signal strength 1 of 5

According to the chart of M5, NZDCAD formed the Bullish Rectangle which is a pattern of a trend continuation. The pattern is contained within the following borders: the lower border
The M5 and M15 time frames may have more false entry points.
Open chart in a new window
Bullish pennant
was formed on 11.05 at 23:31:24 (UTC+0)
signal strength 2 of 5
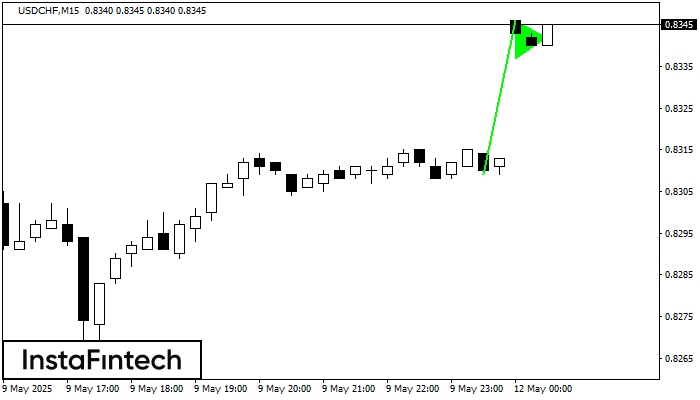
The Bullish pennant pattern is formed on the USDCHF M15 chart. It is a type of the continuation pattern. Supposedly, in case the price is fixed above the pennant’s high
The M5 and M15 time frames may have more false entry points.
Open chart in a new window


