

Corak sebenar

Bearish Flag
was formed on 03.04 at 19:27:20 (UTC+0)
signal strength 1 of 5
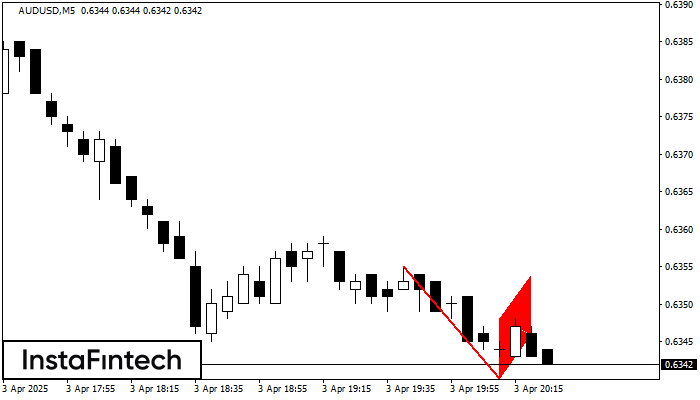
The Bearish Flag pattern has been formed on the chart AUDUSD M5 which signals that the downward trend will continue. If the price breaks below the low at 0.6340, then it is most likely to move further downwards. The price will likely move by the number of points which equals the length of the flag pole (10 points).
The M5 and M15 time frames may have more false entry points.
- All
- All
- Bearish Rectangle
- Bearish Symmetrical Triangle
- Bearish Symmetrical Triangle
- Bullish Rectangle
- Double Top
- Double Top
- Triple Bottom
- Triple Bottom
- Triple Top
- Triple Top
- All
- All
- Buy
- Sale
- All
- 1
- 2
- 3
- 4
- 5
Double Top
was formed on 23.04 at 06:45:11 (UTC+0)
signal strength 2 of 5
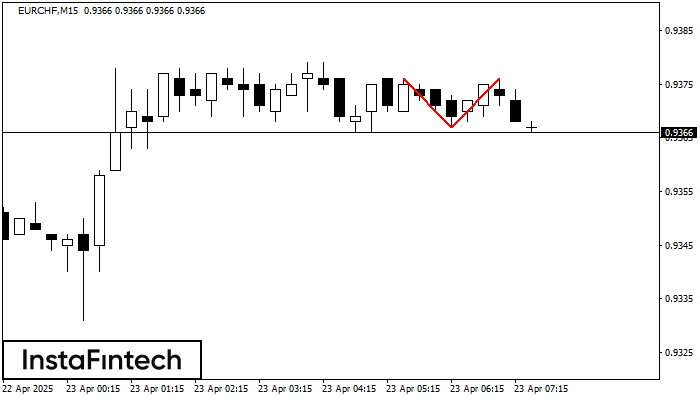
Corak pembalikan Double Top telah dibentuk pada EURCHF M15. Ciri-ciri: sempadan atas %P0.000000; sempadan bawah 0.9376; sempadan bawah 0.9367; lebar corak adalah 9 mata. Dagangan menjual adalah lebih baik untuk
Carta masa M5 dan M15 mungkin mempunyai lebih banyak titik kemasukan palsu.
Open chart in a new window
Inverse Head dan Shoulder
was formed on 23.04 at 06:25:20 (UTC+0)
signal strength 1 of 5
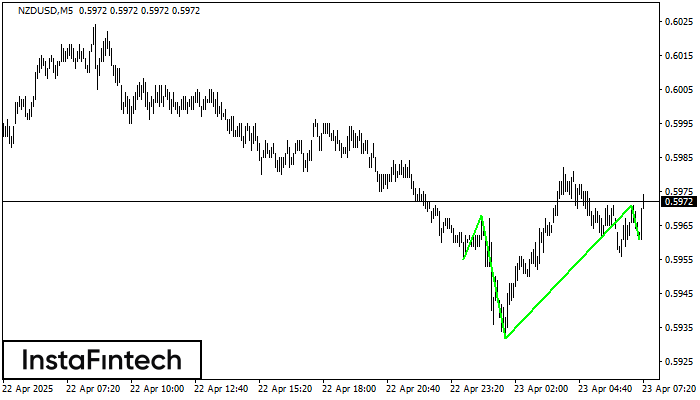
According to M5, NZDUSD is shaping the technical pattern – the Inverse Head dan Shoulder. In case the Neckline 0.5968/0.5971 is broken out, the instrument is likely to move toward
Carta masa M5 dan M15 mungkin mempunyai lebih banyak titik kemasukan palsu.
Open chart in a new window
Double Bottom
was formed on 23.04 at 05:25:25 (UTC+0)
signal strength 1 of 5
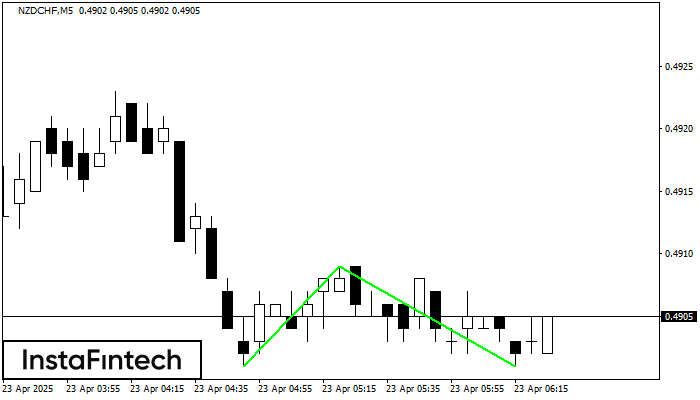
Corak Double Bottom telah dibentuk pada NZDCHF M5. Pembentukan ini menandakan pembalikan aliran dari aliran menurun ke atas. Isyarat ialah perdagangan membeli harus dibuka selepas sempadan atas corak 0.4909 telah
Carta masa M5 dan M15 mungkin mempunyai lebih banyak titik kemasukan palsu.
Open chart in a new window

