

Corak sebenar

Triple Bottom
was formed on 03.04 at 19:10:16 (UTC+0)
signal strength 1 of 5
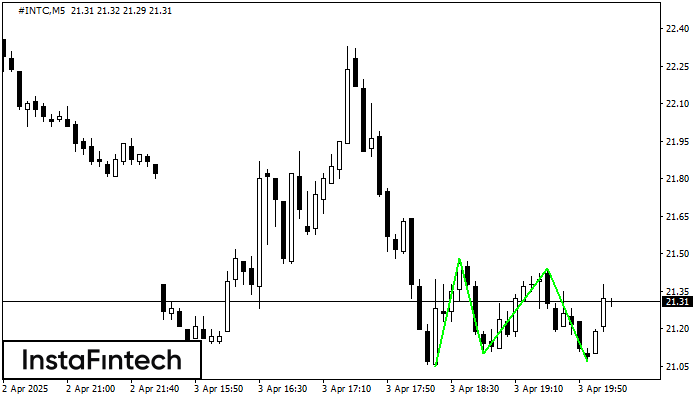
The Triple Bottom pattern has formed on the chart of #INTC M5. Features of the pattern: The lower line of the pattern has coordinates 21.48 with the upper limit 21.48/21.44, the projection of the width is 43 points. The formation of the Triple Bottom pattern most likely indicates a change in the trend from downward to upward. This means that in the event of a breakdown of the resistance level 21.05, the price is most likely to continue the upward movement.
The M5 and M15 time frames may have more false entry points.
- All
- All
- Bearish Rectangle
- Bearish Symmetrical Triangle
- Bearish Symmetrical Triangle
- Bullish Rectangle
- Double Top
- Double Top
- Triple Bottom
- Triple Bottom
- Triple Top
- Triple Top
- All
- All
- Buy
- Sale
- All
- 1
- 2
- 3
- 4
- 5
Segi Empat Menurun
was formed on 11.05 at 20:08:50 (UTC+0)
signal strength 1 of 5
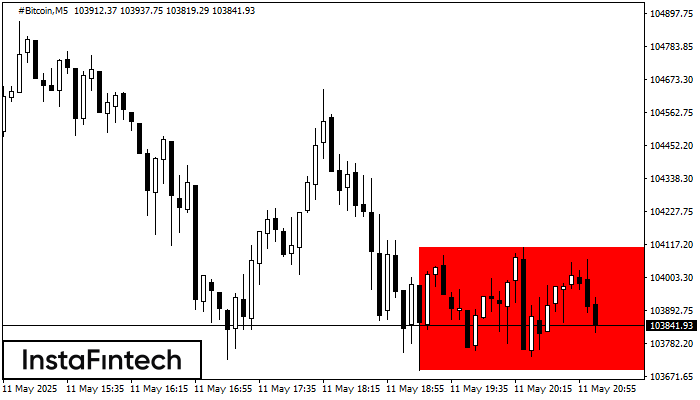
Berdasarkan carta M5, #Bitcoin telah membentuk Segi Empat Menurun yang merupakan corak kesinambungan aliran. Corak terkandung dalam sempadan berikut: sempadan bawah 103691.15 – 103691.15 dan sempadan atas 104107.73 – 104107.73
Carta masa M5 dan M15 mungkin mempunyai lebih banyak titik kemasukan palsu.
Open chart in a new window
Triple Bottom
was formed on 11.05 at 19:05:15 (UTC+0)
signal strength 1 of 5
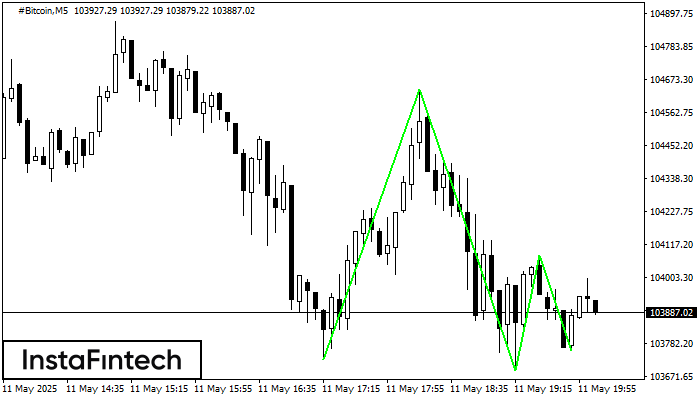
Corak Triple Bottom telah dibentuk pada carta #Bitcoin M5. Ciri-ciri corak: Garisan bawah corak mempunyai koordinat 104640.24 dengan had atas 104640.24/104078.48, unjuran lebar adalah 91343 mata. Pembentukan corak Triple Bottom
Carta masa M5 dan M15 mungkin mempunyai lebih banyak titik kemasukan palsu.
Open chart in a new window
Double Bottom
was formed on 11.05 at 18:30:15 (UTC+0)
signal strength 1 of 5

Corak Double Bottom telah dibentuk pada #Bitcoin M5; sempadan atas adalah 104640.24; sempadan bawah adalah 103691.15. Lebar corak adalah 91343 mata. Sekiranya penembusan sempadan atas 104640.24, perubahan aliran boleh diramalkan
Carta masa M5 dan M15 mungkin mempunyai lebih banyak titik kemasukan palsu.
Open chart in a new window


