

Corak sebenar

Double Bottom
was formed on 03.04 at 14:19:55 (UTC+0)
signal strength 1 of 5
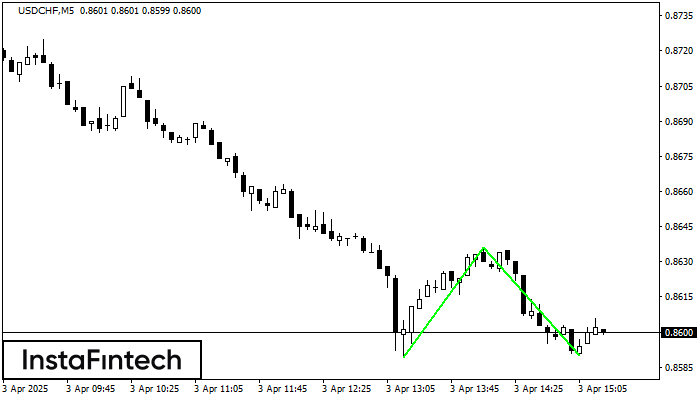
The Double Bottom pattern has been formed on USDCHF M5; the upper boundary is 0.8636; the lower boundary is 0.8590. The width of the pattern is 47 points. In case of a break of the upper boundary 0.8636, a change in the trend can be predicted where the width of the pattern will coincide with the distance to a possible take profit level.
The M5 and M15 time frames may have more false entry points.
- All
- All
- Bearish Rectangle
- Bearish Symmetrical Triangle
- Bearish Symmetrical Triangle
- Bullish Rectangle
- Double Top
- Double Top
- Triple Bottom
- Triple Bottom
- Triple Top
- Triple Top
- All
- All
- Buy
- Sale
- All
- 1
- 2
- 3
- 4
- 5
Double Bottom
was formed on 16.05 at 03:20:16 (UTC+0)
signal strength 1 of 5
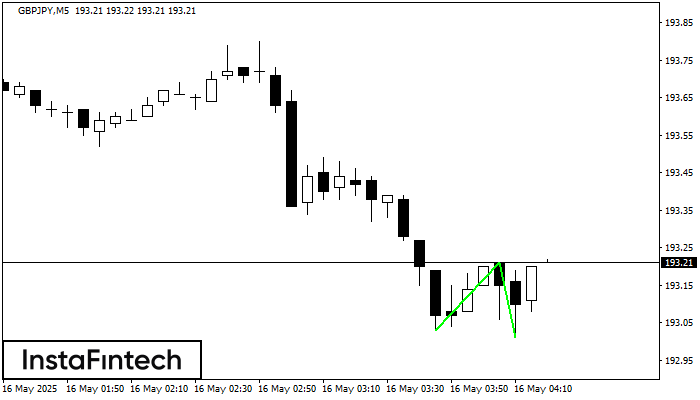
The Double Bottom pattern has been formed on GBPJPY M5; the upper boundary is 193.21; the lower boundary is 193.01. The width of the pattern is 18 points. In case
The M5 and M15 time frames may have more false entry points.
Open chart in a new window
Double Top
was formed on 16.05 at 03:15:25 (UTC+0)
signal strength 2 of 5
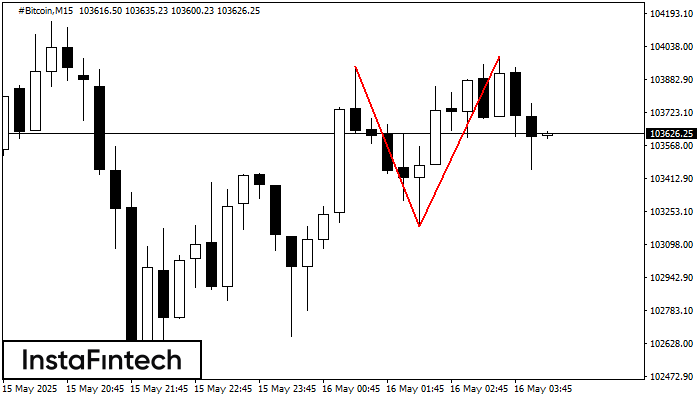
On the chart of #Bitcoin M15 the Double Top reversal pattern has been formed. Characteristics: the upper boundary 103989.31; the lower boundary 103182.63; the width of the pattern 80668 points
The M5 and M15 time frames may have more false entry points.
Open chart in a new window
Triple Top
was formed on 16.05 at 02:15:29 (UTC+0)
signal strength 2 of 5

The Triple Top pattern has formed on the chart of the GBPAUD M15. Features of the pattern: borders have an ascending angle; the lower line of the pattern
The M5 and M15 time frames may have more false entry points.
Open chart in a new window

