

Corak sebenar

Bearish pennant
was formed on 02.04 at 14:55:25 (UTC+0)
signal strength 1 of 5
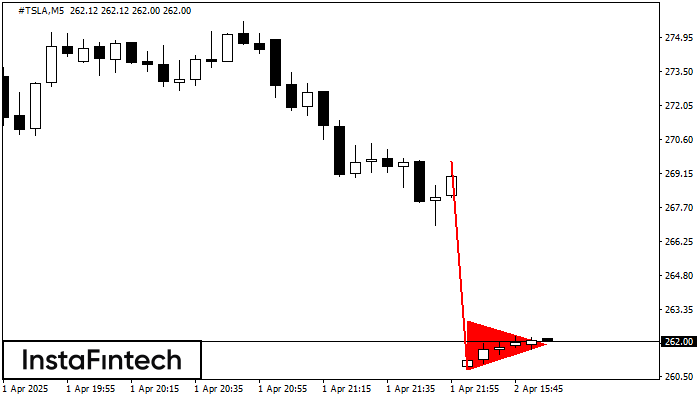
The Bearish pennant pattern has formed on the #TSLA M5 chart. It signals potential continuation of the existing trend. Specifications: the pattern’s bottom has the coordinate of 260.80; the projection of the flagpole height is equal to 887 pips. In case the price breaks out the pattern’s bottom of 260.80, the downtrend is expected to continue for further level 260.65.
The M5 and M15 time frames may have more false entry points.
- All
- All
- Bearish Rectangle
- Bearish Symmetrical Triangle
- Bearish Symmetrical Triangle
- Bullish Rectangle
- Double Top
- Double Top
- Triple Bottom
- Triple Bottom
- Triple Top
- Triple Top
- All
- All
- Buy
- Sale
- All
- 1
- 2
- 3
- 4
- 5
Segi Tiga Simetri Menaik
was formed on 19.05 at 18:13:43 (UTC+0)
signal strength 1 of 5
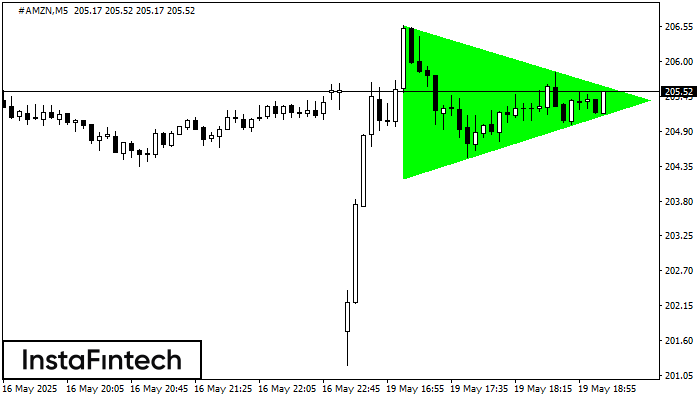
Berdasarkan carta M5, #AMZN membentuk corak Segi Tiga Simetri Menaik yang menandakan aliran akan berterusan. Penerangan. Sempadan atas corak menyentuh koordinat 206.56/205.38 sedangkan sempadan bawah merentasi 204.16/205.38. Lebar corak diukur
Carta masa M5 dan M15 mungkin mempunyai lebih banyak titik kemasukan palsu.
Open chart in a new window
Double Bottom
was formed on 19.05 at 18:00:10 (UTC+0)
signal strength 2 of 5
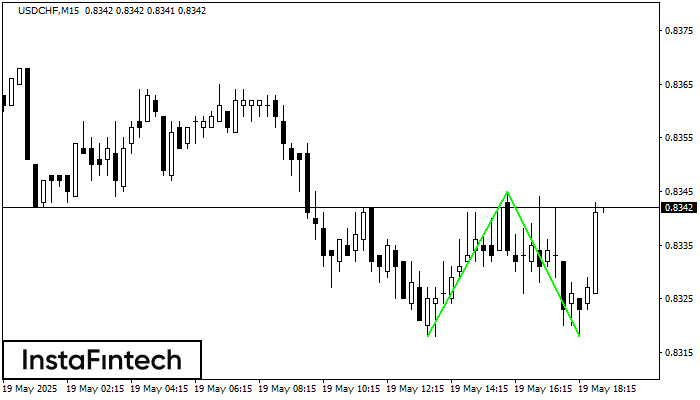
Corak Double Bottom telah dibentuk pada USDCHF M15. Pembentukan ini menandakan pembalikan aliran dari aliran menurun ke atas. Isyarat ialah perdagangan membeli harus dibuka selepas sempadan atas corak 0.8345 telah
Carta masa M5 dan M15 mungkin mempunyai lebih banyak titik kemasukan palsu.
Open chart in a new window
Head dan Shoulders
was formed on 19.05 at 18:00:10 (UTC+0)
signal strength 2 of 5
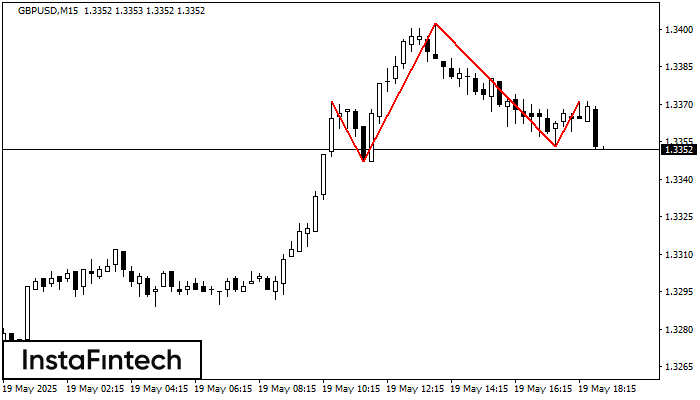
GBPUSD M15 membentuk corak Head dan Shoulders dengan ciri-ciri berikut: Bahagian atas Head adalah 1.3402, garisan Neck dan sudut menaik berada pada 1.3347/1.3353. Pembentukan corak ini boleh membawa perubahan dalam
Carta masa M5 dan M15 mungkin mempunyai lebih banyak titik kemasukan palsu.
Open chart in a new window


