

Corak sebenar

Triple Bottom
was formed on 02.04 at 13:45:17 (UTC+0)
signal strength 2 of 5
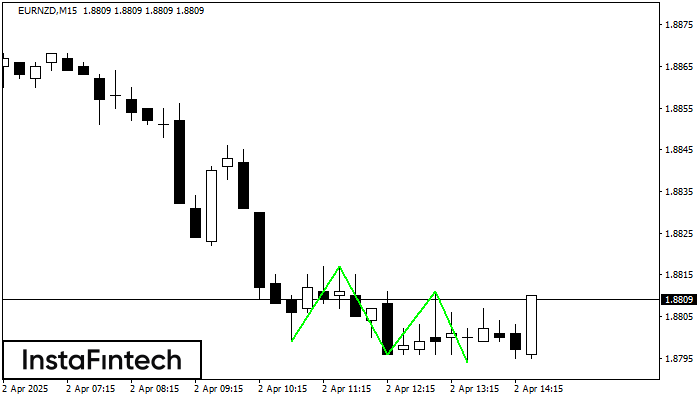
The Triple Bottom pattern has formed on the chart of EURNZD M15. Features of the pattern: The lower line of the pattern has coordinates 1.8817 with the upper limit 1.8817/1.8811, the projection of the width is 18 points. The formation of the Triple Bottom pattern most likely indicates a change in the trend from downward to upward. This means that in the event of a breakdown of the resistance level 1.8799, the price is most likely to continue the upward movement.
The M5 and M15 time frames may have more false entry points.
- All
- All
- Bearish Rectangle
- Bearish Symmetrical Triangle
- Bearish Symmetrical Triangle
- Bullish Rectangle
- Double Top
- Double Top
- Triple Bottom
- Triple Bottom
- Triple Top
- Triple Top
- All
- All
- Buy
- Sale
- All
- 1
- 2
- 3
- 4
- 5
Head dan Shoulders
was formed on 14.05 at 08:15:39 (UTC+0)
signal strength 2 of 5
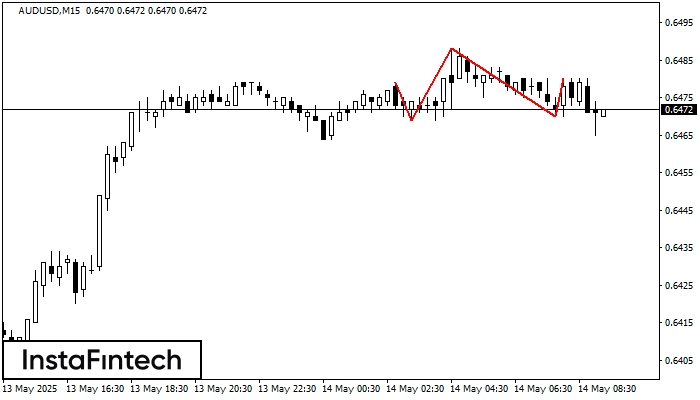
Corak teknikal yang dipanggil Head dan Shoulders telah muncul pada carta AUDUSD M15. Terdapat alasan yang berat untuk menunjukkan bahawa harga akan mengatasi garisan Neck 0.6469/0.6470 selepas Shoulder kanan telah
Carta masa M5 dan M15 mungkin mempunyai lebih banyak titik kemasukan palsu.
Open chart in a new window
Segi Empat Menaik
was formed on 14.05 at 07:47:39 (UTC+0)
signal strength 3 of 5
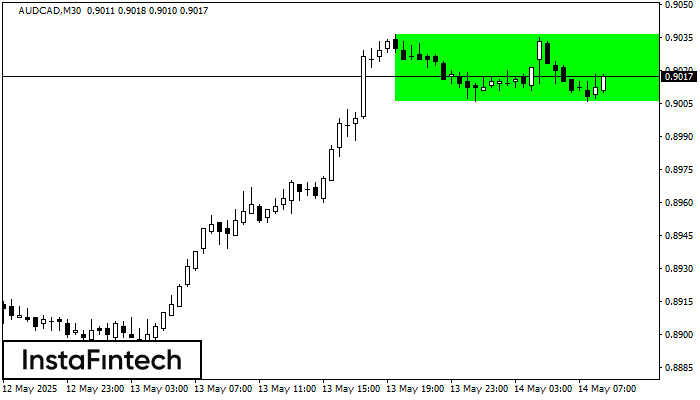
Berdasarkan carta M30, AUDCAD telah membentuk Segi Empat Menaik. Jenis corak ini menunjukkan kesinambungan aliran. Ia terdiri daripada dua tahap: rintangan 0.9036 dan sokongan 0.9006. Sekiranya tahap rintangan 0.9036
Open chart in a new window
Triple Bottom
was formed on 14.05 at 07:45:28 (UTC+0)
signal strength 2 of 5
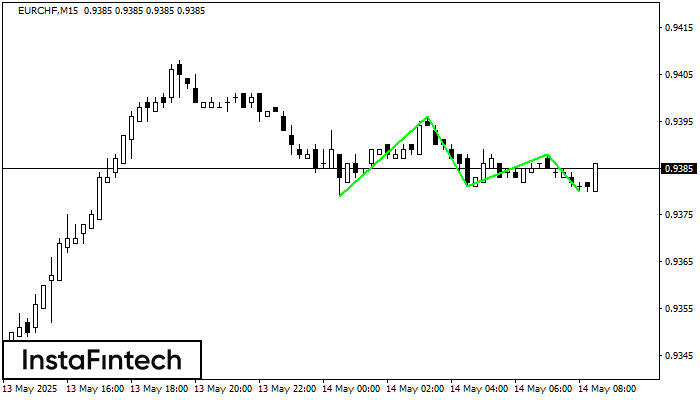
Corak Triple Bottom telah dibentuk pada carta bagi instrumen dagangan EURCHF M15. Corak menandakan perubahan aliran dari menurun ke aliran menaik dalam sekiranya penembusan 0.9396/0.9388
Carta masa M5 dan M15 mungkin mempunyai lebih banyak titik kemasukan palsu.
Open chart in a new window


