

Corak sebenar

Bullish Symmetrical Triangle
was formed on 02.04 at 10:35:34 (UTC+0)
signal strength 1 of 5
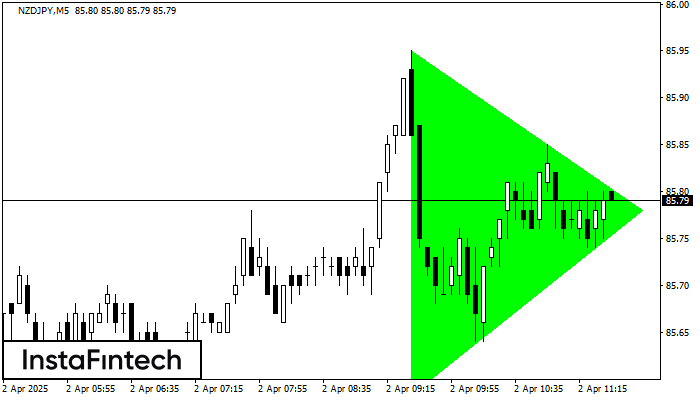
According to the chart of M5, NZDJPY formed the Bullish Symmetrical Triangle pattern, which signals the trend will continue. Description. The upper border of the pattern touches the coordinates 85.95/85.78 whereas the lower border goes across 85.58/85.78. The pattern width is measured on the chart at 37 pips. If the Bullish Symmetrical Triangle pattern is in progress during the upward trend, this indicates the current trend will go on. In case 85.78 is broken, the price could continue its move toward 85.93.
The M5 and M15 time frames may have more false entry points.
Juga lihat
- All
- All
- Bearish Rectangle
- Bearish Symmetrical Triangle
- Bearish Symmetrical Triangle
- Bullish Rectangle
- Double Top
- Double Top
- Triple Bottom
- Triple Bottom
- Triple Top
- Triple Top
- All
- All
- Buy
- Sale
- All
- 1
- 2
- 3
- 4
- 5
Triple Bottom
was formed on 08.04 at 15:32:40 (UTC+0)
signal strength 2 of 5
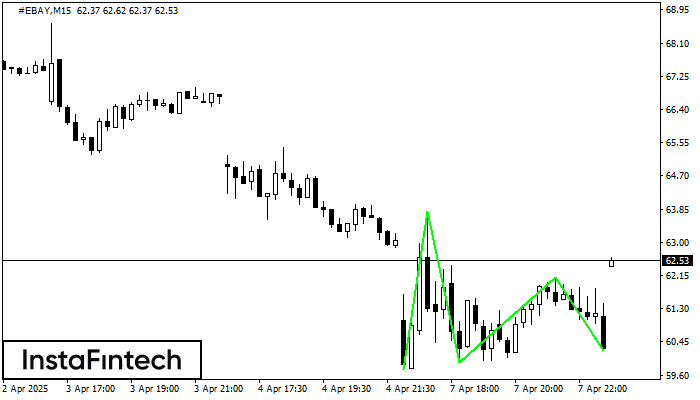
Corak Triple Bottom telah dibentuk pada carta bagi instrumen dagangan #EBAY M15. Corak menandakan perubahan aliran dari menurun ke aliran menaik dalam sekiranya penembusan 63.80/62.11
Carta masa M5 dan M15 mungkin mempunyai lebih banyak titik kemasukan palsu.
Open chart in a new window
Pennant Aliran Menurun
was formed on 08.04 at 15:30:28 (UTC+0)
signal strength 4 of 5
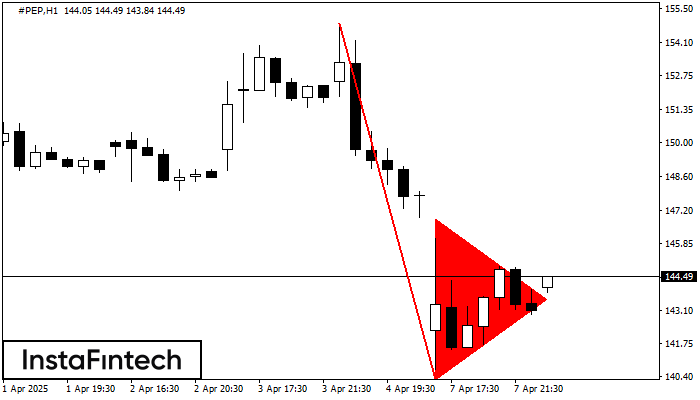
Corak Pennant Aliran Menurun telah dibentuk pada carta #PEP H1. Corak menandakan kesinambungan aliran menurun sekiranya aliran pennant rendah 140.24 ditembusi. Cadangan: Meletakkan pesanan penanguhan sell stop
Open chart in a new window
Pennant Aliran Menurun
was formed on 08.04 at 15:30:16 (UTC+0)
signal strength 4 of 5
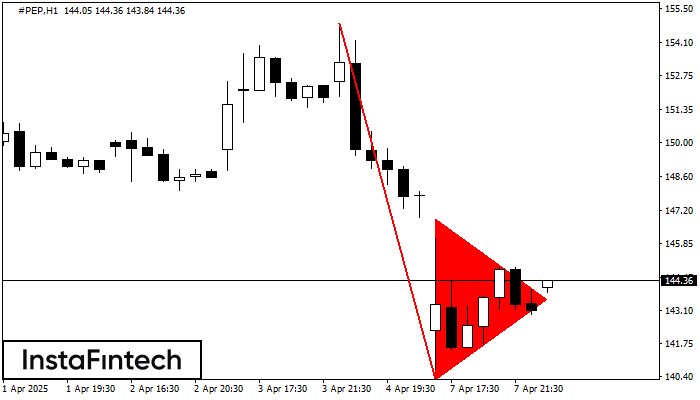
Corak Pennant Aliran Menurun telah dibentuk pada carta #PEP H1. Jenis corak ini dicirikan oleh sedikit penurunan di mana selepas itu harga akan bergerak ke arah aliran asal. Sekiranya harga
Open chart in a new window


