

Corak sebenar

Bullish Rectangle
was formed on 01.04 at 20:31:48 (UTC+0)
signal strength 1 of 5
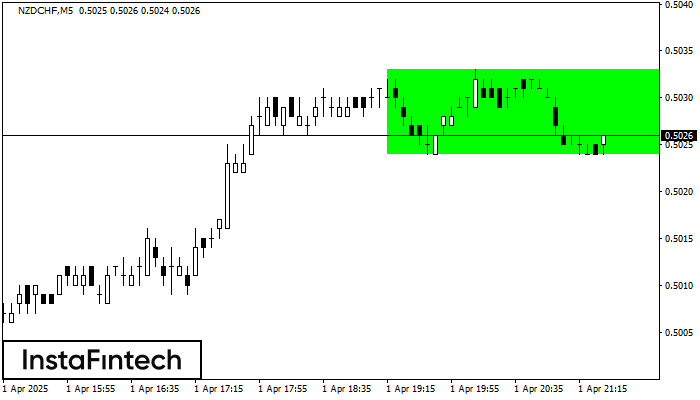
According to the chart of M5, NZDCHF formed the Bullish Rectangle. This type of a pattern indicates a trend continuation. It consists of two levels: resistance 0.5033 and support 0.5024. In case the resistance level 0.5033 - 0.5033 is broken, the instrument is likely to follow the bullish trend.
The M5 and M15 time frames may have more false entry points.
- All
- All
- Bearish Rectangle
- Bearish Symmetrical Triangle
- Bearish Symmetrical Triangle
- Bullish Rectangle
- Double Top
- Double Top
- Triple Bottom
- Triple Bottom
- Triple Top
- Triple Top
- All
- All
- Buy
- Sale
- All
- 1
- 2
- 3
- 4
- 5
Head and Shoulders
was formed on 21.05 at 03:00:10 (UTC+0)
signal strength 3 of 5
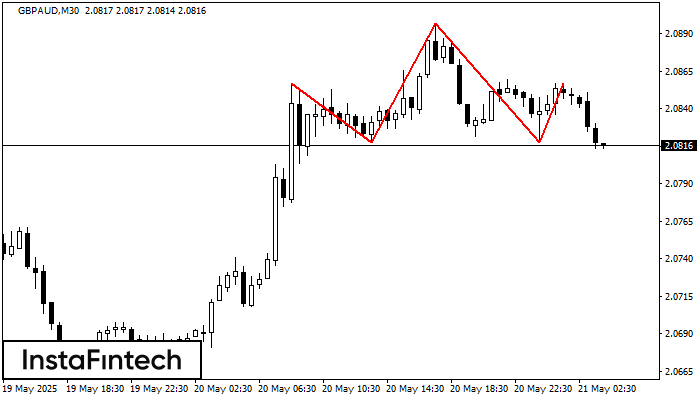
The GBPAUD M30 formed the Head and Shoulders pattern with the following features: The Head’s top is at 2.0897, the Neckline and the upward angle are at 2.0818/2.0818. The formation
Open chart in a new window
Triple Top
was formed on 21.05 at 02:00:36 (UTC+0)
signal strength 3 of 5
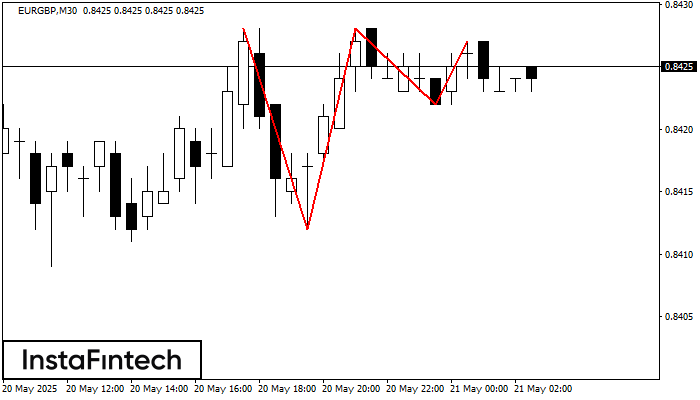
On the chart of the EURGBP M30 trading instrument, the Triple Top pattern that signals a trend change has formed. It is possible that after formation of the third peak
Open chart in a new window
Bullish Rectangle
was formed on 21.05 at 00:46:25 (UTC+0)
signal strength 1 of 5
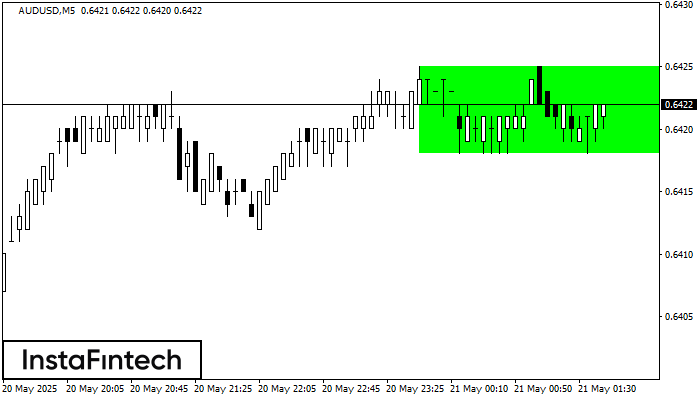
According to the chart of M5, AUDUSD formed the Bullish Rectangle which is a pattern of a trend continuation. The pattern is contained within the following borders: the lower border
The M5 and M15 time frames may have more false entry points.
Open chart in a new window

