

Corak sebenar

Triple Bottom
was formed on 01.04 at 20:15:17 (UTC+0)
signal strength 1 of 5
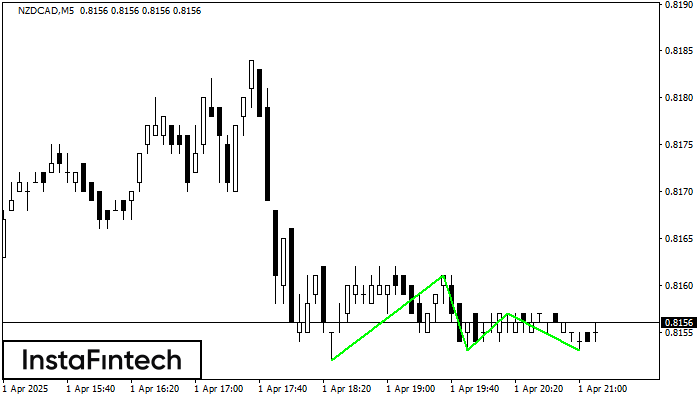
The Triple Bottom pattern has formed on the chart of the NZDCAD M5 trading instrument. The pattern signals a change in the trend from downwards to upwards in the case of breakdown of 0.8161/0.8157.
The M5 and M15 time frames may have more false entry points.
- All
- All
- Bearish Rectangle
- Bearish Symmetrical Triangle
- Bearish Symmetrical Triangle
- Bullish Rectangle
- Double Top
- Double Top
- Triple Bottom
- Triple Bottom
- Triple Top
- Triple Top
- All
- All
- Buy
- Sale
- All
- 1
- 2
- 3
- 4
- 5
Triple Top
сформирован 13.05 в 18:45:11 (UTC+0)
сила сигнала 1 из 5
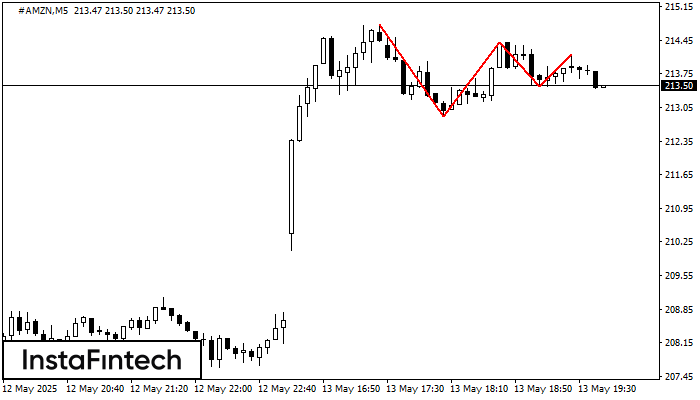
The Triple Top pattern has formed on the chart of the #AMZN M5 trading instrument. It is a reversal pattern featuring the following characteristics: resistance level 63, support level -61
The M5 and M15 time frames may have more false entry points.
Открыть график инструмента в новом окне
Bullish Flag
сформирован 13.05 в 18:36:15 (UTC+0)
сила сигнала 3 из 5
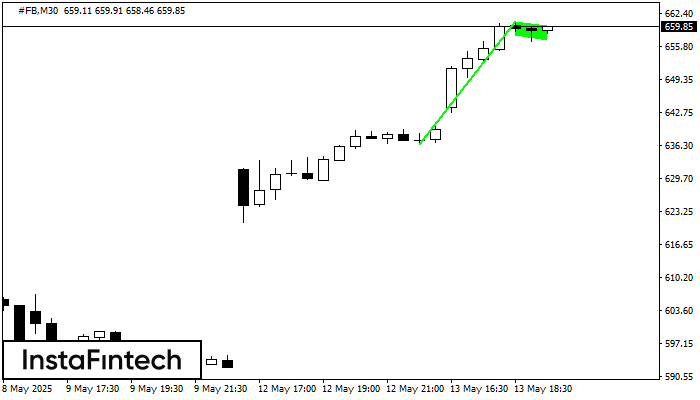
The Bullish Flag pattern which signals continuation of a trend has been formed on the chart #FB M30. Forecast: if the price breaks above the pattern high at 660.84, then
Открыть график инструмента в новом окне
Triple Bottom
сформирован 13.05 в 18:35:14 (UTC+0)
сила сигнала 1 из 5
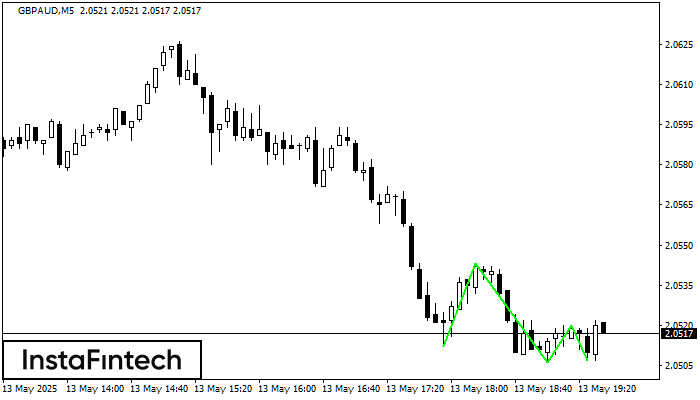
The Triple Bottom pattern has formed on the chart of the GBPAUD M5 trading instrument. The pattern signals a change in the trend from downwards to upwards in the case
The M5 and M15 time frames may have more false entry points.
Открыть график инструмента в новом окне


