

Corak sebenar

Bullish Rectangle
was formed on 01.04 at 19:41:48 (UTC+0)
signal strength 1 of 5
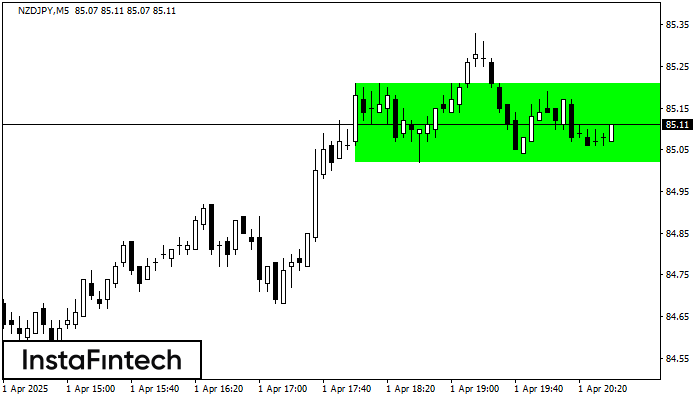
According to the chart of M5, NZDJPY formed the Bullish Rectangle which is a pattern of a trend continuation. The pattern is contained within the following borders: the lower border 85.02 – 85.02 and upper border 85.21 – 85.21. In case the upper border is broken, the instrument is likely to follow the upward trend.
The M5 and M15 time frames may have more false entry points.
- All
- All
- Bearish Rectangle
- Bearish Symmetrical Triangle
- Bearish Symmetrical Triangle
- Bullish Rectangle
- Double Top
- Double Top
- Triple Bottom
- Triple Bottom
- Triple Top
- Triple Top
- All
- All
- Buy
- Sale
- All
- 1
- 2
- 3
- 4
- 5
Double Bottom
was formed on 22.05 at 17:45:33 (UTC+0)
signal strength 2 of 5
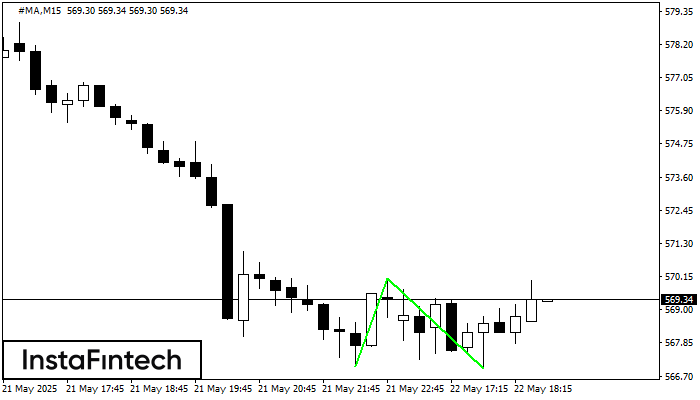
Corak Double Bottom telah dibentuk pada #MA M15. Pembentukan ini menandakan pembalikan aliran dari aliran menurun ke atas. Isyarat ialah perdagangan membeli harus dibuka selepas sempadan atas corak 570.10 telah
Carta masa M5 dan M15 mungkin mempunyai lebih banyak titik kemasukan palsu.
Open chart in a new window
Double Top
was formed on 22.05 at 17:30:27 (UTC+0)
signal strength 1 of 5
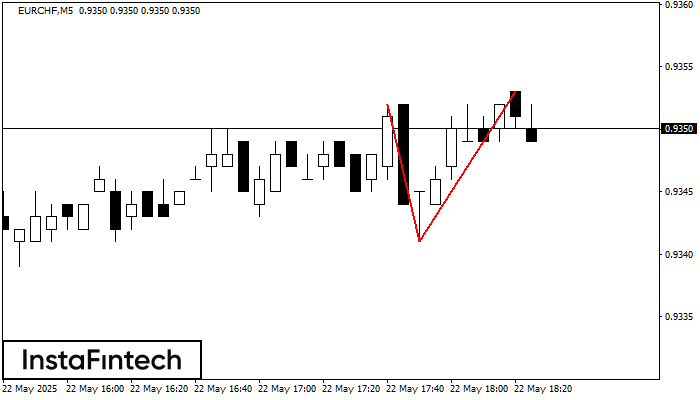
Corak pembalikan Double Top telah dibentuk pada EURCHF M5. Ciri-ciri: sempadan atas %P0.000000; sempadan bawah 0.9352; sempadan bawah 0.9341; lebar corak adalah 12 mata. Dagangan menjual adalah lebih baik untuk
Carta masa M5 dan M15 mungkin mempunyai lebih banyak titik kemasukan palsu.
Open chart in a new window
Head dan Shoulders
was formed on 22.05 at 17:00:26 (UTC+0)
signal strength 4 of 5
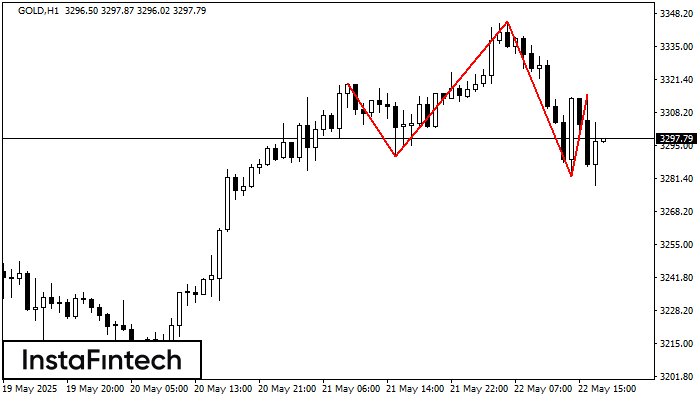
GOLD H1 membentuk corak Head dan Shoulders dengan ciri-ciri berikut: Bahagian atas Head adalah 3344.99, garisan Neck dan sudut menaik berada pada 3290.48/3282.56. Pembentukan corak ini boleh membawa perubahan dalam
Open chart in a new window


