

Corak sebenar

Triple Top
was formed on 28.03 at 14:10:07 (UTC+0)
signal strength 1 of 5
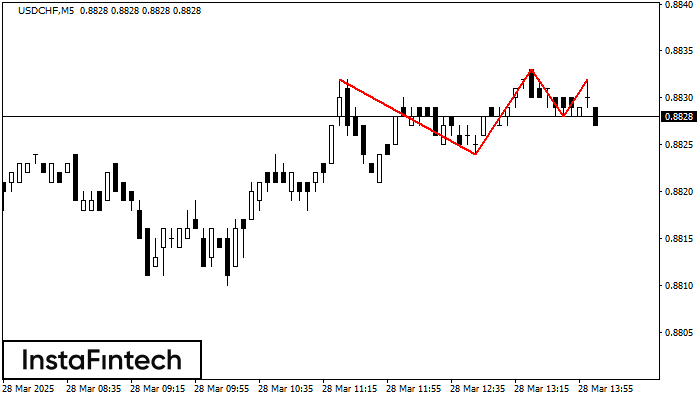
The Triple Top pattern has formed on the chart of the USDCHF M5. Features of the pattern: borders have an ascending angle; the lower line of the pattern has the coordinates 0.8824/0.8828 with the upper limit 0.8832/0.8832; the projection of the width is 8 points. The formation of the Triple Top figure most likely indicates a change in the trend from upward to downward. This means that in the event of a breakdown of the support level of 0.8824, the price is most likely to continue the downward movement.
The M5 and M15 time frames may have more false entry points.
Juga lihat
- All
- All
- Bearish Rectangle
- Bearish Symmetrical Triangle
- Bearish Symmetrical Triangle
- Bullish Rectangle
- Double Top
- Double Top
- Triple Bottom
- Triple Bottom
- Triple Top
- Triple Top
- All
- All
- Buy
- Sale
- All
- 1
- 2
- 3
- 4
- 5
Đỉnh đôi
was formed on 16.05 at 21:55:25 (UTC+0)
signal strength 1 of 5

Mô hình đảo chiều Đỉnh đôi đã được hình thành trên #INTC M5. Đặc điểm: ranh giới trên 21.76; ranh giới dưới 21.69; chiều rộng của mô hình
Khung thời gian M5 và M15 có thể có nhiều điểm vào lệnh sai hơn.
Open chart in a new window
Đáy ba
was formed on 16.05 at 21:50:12 (UTC+0)
signal strength 1 of 5
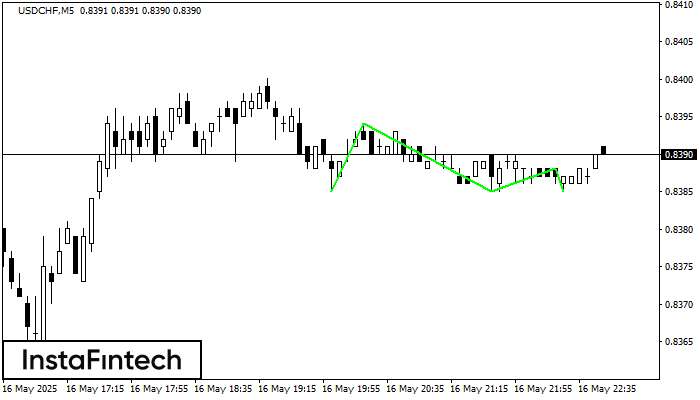
Mô hình Đáy ba đã được hình thành trên USDCHF M5. Nó có các đặc điểm sau: mức kháng cự 0.8394/0.8388; mức hỗ trợ 0.8385/0.8385; chiều rộng là 9 điểm
Khung thời gian M5 và M15 có thể có nhiều điểm vào lệnh sai hơn.
Open chart in a new window
Đỉnh đôi
was formed on 16.05 at 21:25:08 (UTC+0)
signal strength 1 of 5
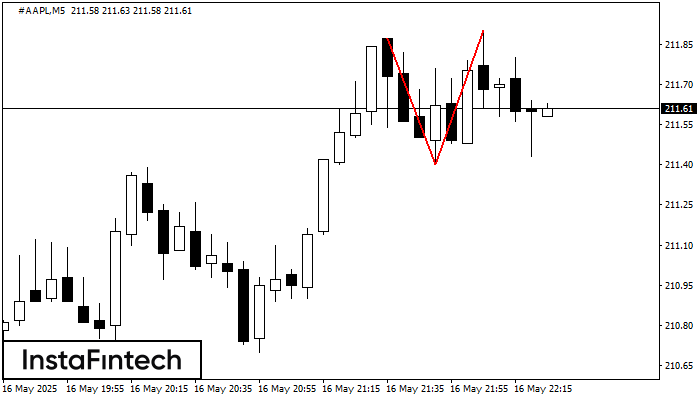
Mô hình đảo chiều Đỉnh đôi đã được hình thành trên #AAPL M5. Đặc điểm: ranh giới trên 211.87; ranh giới dưới 211.40; chiều rộng của mô hình
Khung thời gian M5 và M15 có thể có nhiều điểm vào lệnh sai hơn.
Open chart in a new window


