

Corak sebenar

Bearish Symmetrical Triangle
was formed on 28.03 at 13:59:43 (UTC+0)
signal strength 4 of 5
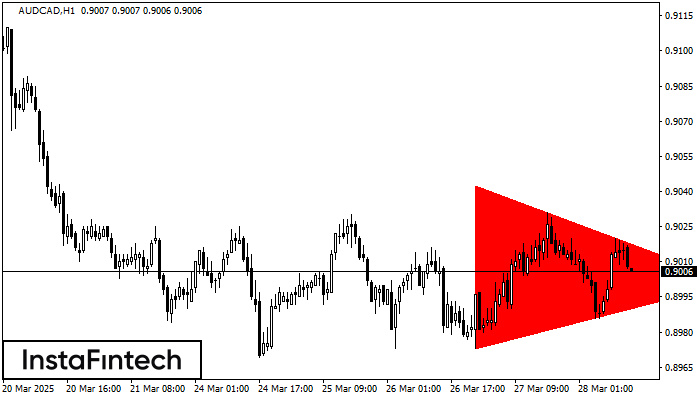
According to the chart of H1, AUDCAD formed the Bearish Symmetrical Triangle pattern. This pattern signals a further downward trend in case the lower border 0.8973 is breached. Here, a hypothetical profit will equal the width of the available pattern that is -70 pips.
Juga lihat
- All
- All
- Bearish Rectangle
- Bearish Symmetrical Triangle
- Bearish Symmetrical Triangle
- Bullish Rectangle
- Double Top
- Double Top
- Triple Bottom
- Triple Bottom
- Triple Top
- Triple Top
- All
- All
- Buy
- Sale
- All
- 1
- 2
- 3
- 4
- 5
Double Top
was formed on 24.04 at 20:20:14 (UTC+0)
signal strength 1 of 5
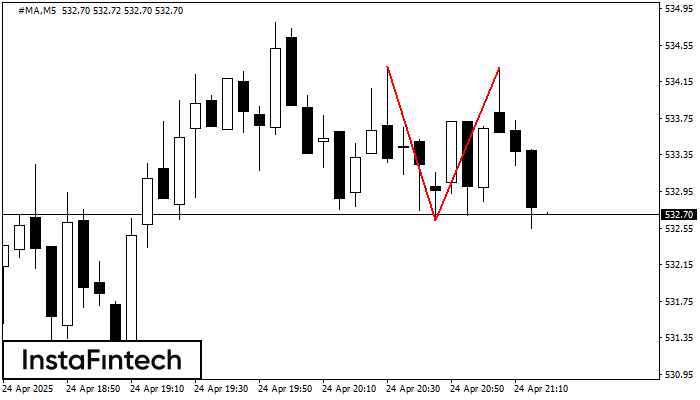
The Double Top reversal pattern has been formed on #MA M5. Characteristics: the upper boundary 534.32; the lower boundary 532.63; the width of the pattern is 168 points. Sell trades
The M5 and M15 time frames may have more false entry points.
Open chart in a new window
Double Top
was formed on 24.04 at 20:00:20 (UTC+0)
signal strength 2 of 5
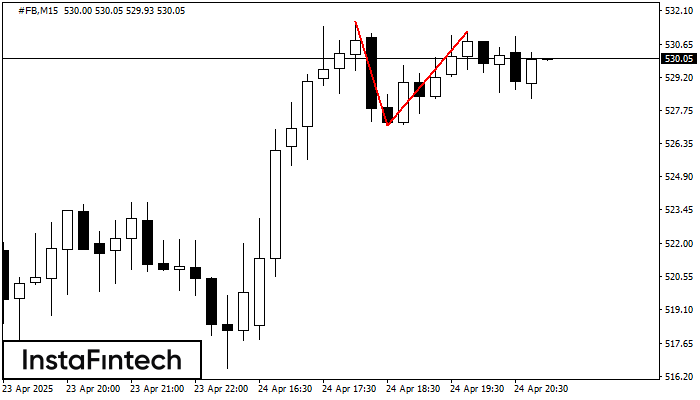
On the chart of #FB M15 the Double Top reversal pattern has been formed. Characteristics: the upper boundary 531.20; the lower boundary 527.14; the width of the pattern 406 points
The M5 and M15 time frames may have more false entry points.
Open chart in a new window
Triple Top
was formed on 24.04 at 19:50:28 (UTC+0)
signal strength 1 of 5
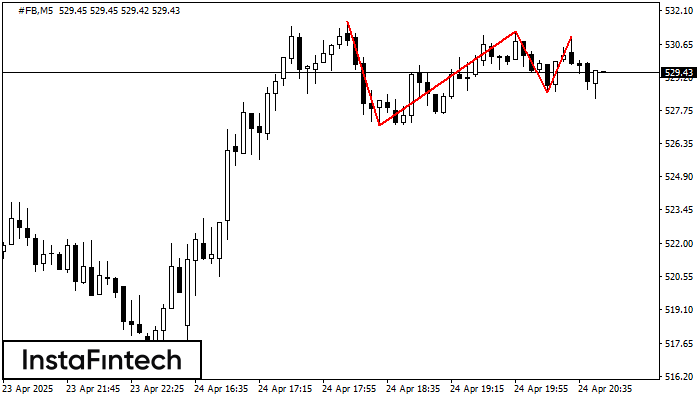
On the chart of the #FB M5 trading instrument, the Triple Top pattern that signals a trend change has formed. It is possible that after formation of the third peak
The M5 and M15 time frames may have more false entry points.
Open chart in a new window


