

Corak sebenar

Double Bottom
was formed on 28.03 at 09:30:15 (UTC+0)
signal strength 2 of 5
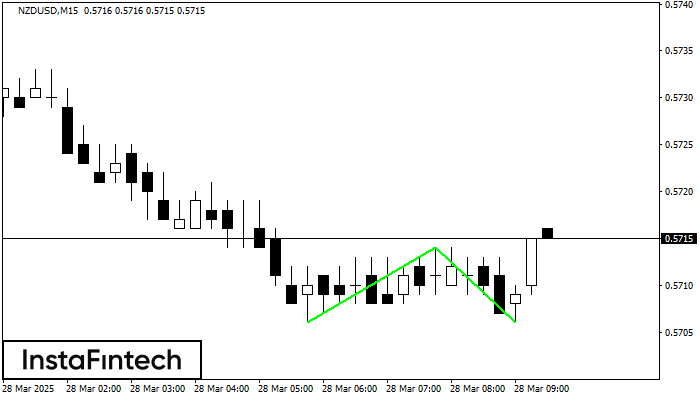
The Double Bottom pattern has been formed on NZDUSD M15. This formation signals a reversal of the trend from downwards to upwards. The signal is that a buy trade should be opened after the upper boundary of the pattern 0.5714 is broken. The further movements will rely on the width of the current pattern 8 points.
The M5 and M15 time frames may have more false entry points.
- All
- All
- Bearish Rectangle
- Bearish Symmetrical Triangle
- Bearish Symmetrical Triangle
- Bullish Rectangle
- Double Top
- Double Top
- Triple Bottom
- Triple Bottom
- Triple Top
- Triple Top
- All
- All
- Buy
- Sale
- All
- 1
- 2
- 3
- 4
- 5
Double Top
was formed on 24.04 at 11:40:32 (UTC+0)
signal strength 1 of 5
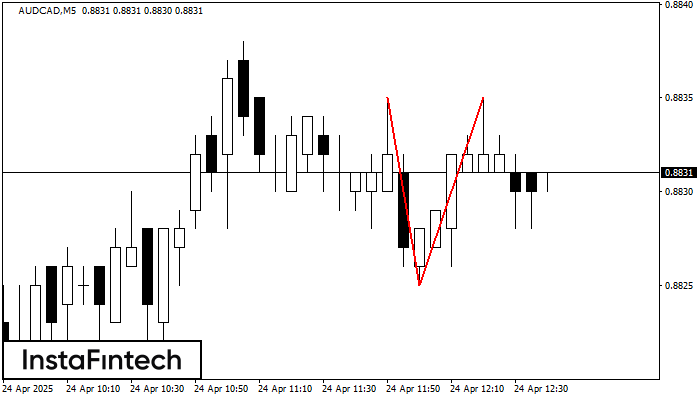
On the chart of AUDCAD M5 the Double Top reversal pattern has been formed. Characteristics: the upper boundary 0.8835; the lower boundary 0.8825; the width of the pattern 10 points
The M5 and M15 time frames may have more false entry points.
Open chart in a new window
Double Top
was formed on 24.04 at 11:35:08 (UTC+0)
signal strength 1 of 5
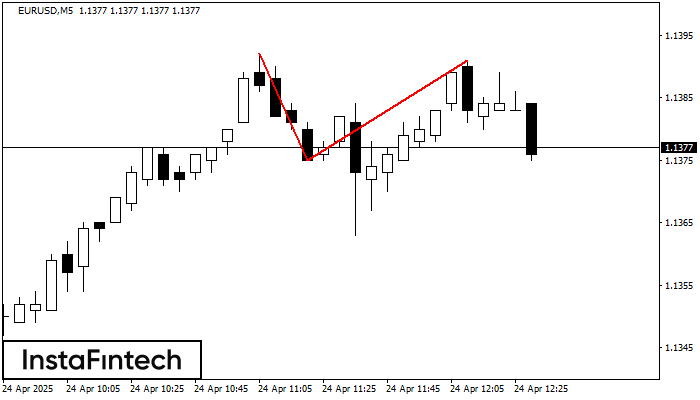
The Double Top reversal pattern has been formed on EURUSD M5. Characteristics: the upper boundary 1.1392; the lower boundary 1.1375; the width of the pattern is 16 points. Sell trades
The M5 and M15 time frames may have more false entry points.
Open chart in a new window
Double Bottom
was formed on 24.04 at 11:30:18 (UTC+0)
signal strength 1 of 5
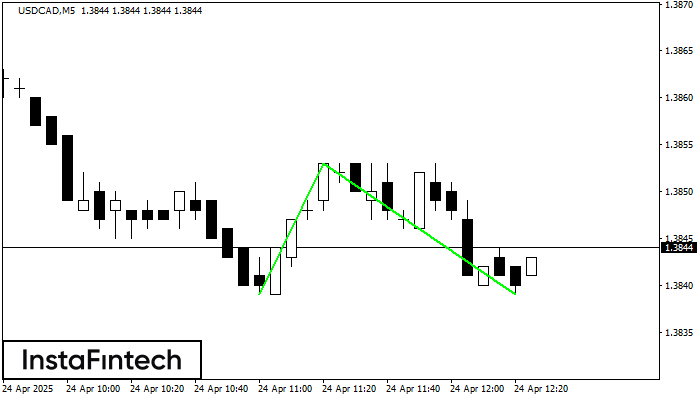
The Double Bottom pattern has been formed on USDCAD M5; the upper boundary is 1.3853; the lower boundary is 1.3839. The width of the pattern is 14 points. In case
The M5 and M15 time frames may have more false entry points.
Open chart in a new window


