

Corak sebenar

Double Bottom
was formed on 28.03 at 06:45:31 (UTC+0)
signal strength 2 of 5
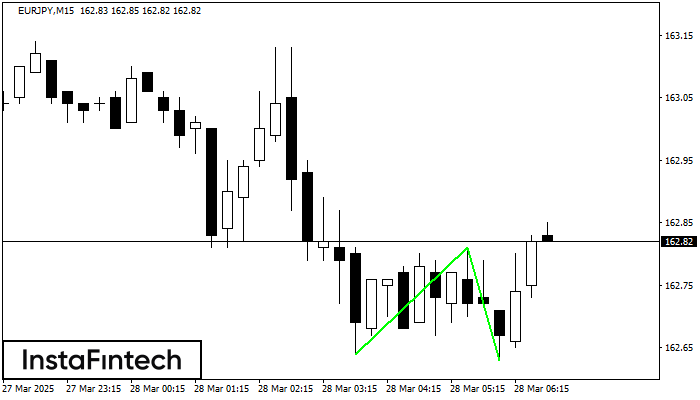
The Double Bottom pattern has been formed on EURJPY M15. This formation signals a reversal of the trend from downwards to upwards. The signal is that a buy trade should be opened after the upper boundary of the pattern 162.81 is broken. The further movements will rely on the width of the current pattern 17 points.
The M5 and M15 time frames may have more false entry points.
- All
- All
- Bearish Rectangle
- Bearish Symmetrical Triangle
- Bearish Symmetrical Triangle
- Bullish Rectangle
- Double Top
- Double Top
- Triple Bottom
- Triple Bottom
- Triple Top
- Triple Top
- All
- All
- Buy
- Sale
- All
- 1
- 2
- 3
- 4
- 5
Double Top
was formed on 21.05 at 11:20:28 (UTC+0)
signal strength 1 of 5
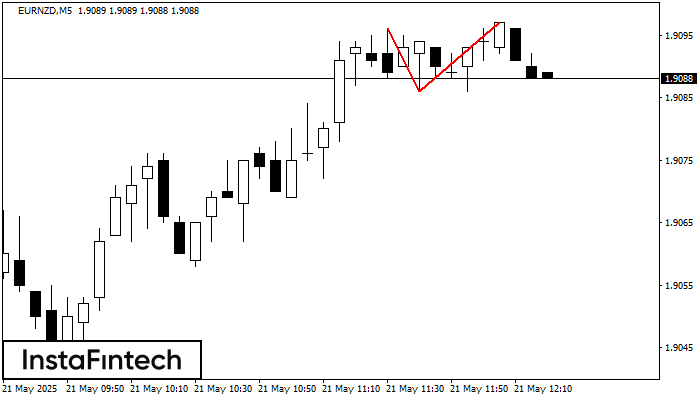
Corak pembalikan Double Top telah dibentuk pada EURNZD M5. Ciri-ciri: sempadan atas %P0.000000; sempadan bawah 1.9096; sempadan bawah 1.9086; lebar corak adalah 11 mata. Dagangan menjual adalah lebih baik untuk
Carta masa M5 dan M15 mungkin mempunyai lebih banyak titik kemasukan palsu.
Open chart in a new window
Inverse Head dan Shoulder
was formed on 21.05 at 10:40:34 (UTC+0)
signal strength 1 of 5
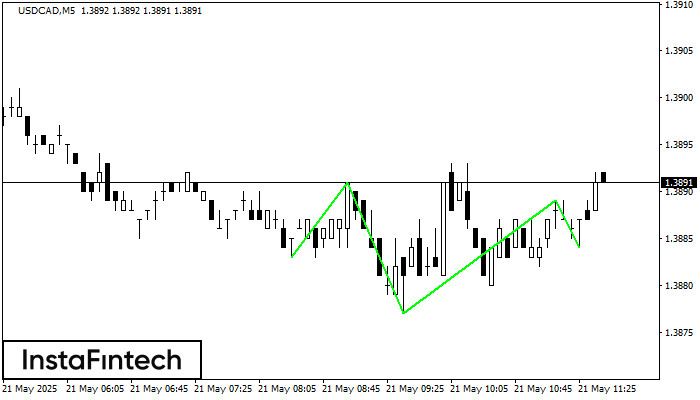
Berdasarkan carta M5, USDCAD membentuk corak Inverse Head dan Shoulder. Bahagian atas Head ditetapkan pada 1.3889 manakala garisan median Neck didapati pada 1.3877/1.3884. Pembentukan corak Inverse Head dan Shoulder jelas
Carta masa M5 dan M15 mungkin mempunyai lebih banyak titik kemasukan palsu.
Open chart in a new window
Triple Bottom
was formed on 21.05 at 10:00:16 (UTC+0)
signal strength 4 of 5
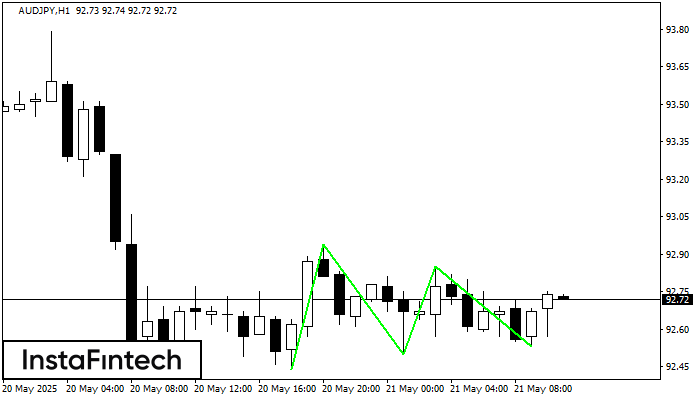
Corak Triple Bottom telah dibentuk pada AUDJPY H1. Ia mempunyai ciri-ciri berikut: tahap rintangan 92.94/92.85; tahap sokongan 92.44/92.53; lebar corak adalah 50 mata. Dalam situasi penembusan paras rintangan 92.94, harga
Open chart in a new window


