

Corak sebenar

Triple Top
was formed on 27.03 at 04:30:09 (UTC+0)
signal strength 2 of 5
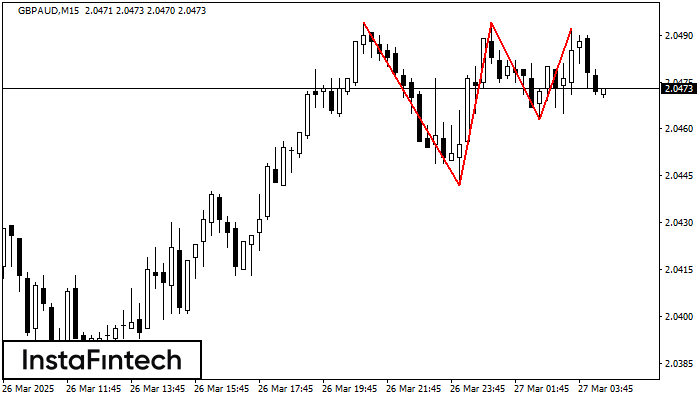
On the chart of the GBPAUD M15 trading instrument, the Triple Top pattern that signals a trend change has formed. It is possible that after formation of the third peak, the price will try to break through the resistance level 2.0442, where we advise to open a trading position for sale. Take profit is the projection of the pattern’s width, which is 52 points.
The M5 and M15 time frames may have more false entry points.
Juga lihat
- All
- All
- Bearish Rectangle
- Bearish Symmetrical Triangle
- Bearish Symmetrical Triangle
- Bullish Rectangle
- Double Top
- Double Top
- Triple Bottom
- Triple Bottom
- Triple Top
- Triple Top
- All
- All
- Buy
- Sale
- All
- 1
- 2
- 3
- 4
- 5
Triple Bottom
was formed on 17.05 at 17:00:17 (UTC+0)
signal strength 3 of 5

Corak Triple Bottom telah dibentuk pada #Bitcoin M30. Ia mempunyai ciri-ciri berikut: tahap rintangan 103658.13/103057.03; tahap sokongan 102549.85/102590.27; lebar corak adalah 110828 mata. Dalam situasi penembusan paras rintangan 103658.13, harga
Open chart in a new window
Inverse Head dan Shoulder
was formed on 17.05 at 05:40:01 (UTC+0)
signal strength 1 of 5

Berdasarkan carta M5, #Bitcoin menghasilkan corak yang dinyatakan Inverse Head dan Shoulder. Head telah ditetapkan pada 102549.85 manakala garisan median Neck ditetapkan pada 103359.60/103319.80. Pembentukan Corak Inverse Head dan Shoulder
Carta masa M5 dan M15 mungkin mempunyai lebih banyak titik kemasukan palsu.
Open chart in a new window
Double Bottom
was formed on 17.05 at 02:15:26 (UTC+0)
signal strength 1 of 5

Corak Double Bottom telah dibentuk pada #Bitcoin M5; sempadan atas adalah 103642.04; sempadan bawah adalah 103357.83. Lebar corak adalah 27887 mata. Sekiranya penembusan sempadan atas 103642.04, perubahan aliran boleh diramalkan
Carta masa M5 dan M15 mungkin mempunyai lebih banyak titik kemasukan palsu.
Open chart in a new window


