

Corak sebenar

Double Bottom
was formed on 27.03 at 00:00:09 (UTC+0)
signal strength 4 of 5
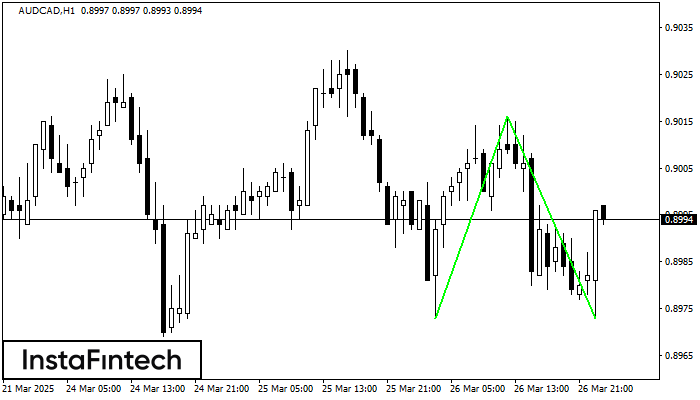
The Double Bottom pattern has been formed on AUDCAD H1; the upper boundary is 0.9016; the lower boundary is 0.8973. The width of the pattern is 43 points. In case of a break of the upper boundary 0.9016, a change in the trend can be predicted where the width of the pattern will coincide with the distance to a possible take profit level.
- All
- All
- Bearish Rectangle
- Bearish Symmetrical Triangle
- Bearish Symmetrical Triangle
- Bullish Rectangle
- Double Top
- Double Top
- Triple Bottom
- Triple Bottom
- Triple Top
- Triple Top
- All
- All
- Buy
- Sale
- All
- 1
- 2
- 3
- 4
- 5
Bearish Symmetrical Triangle
was formed on 23.05 at 00:02:32 (UTC+0)
signal strength 2 of 5
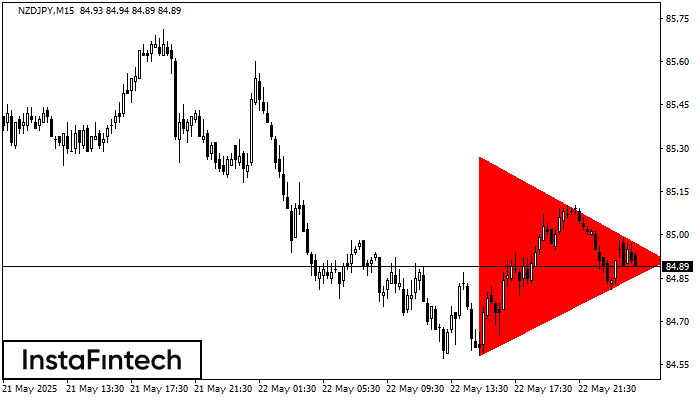
According to the chart of M15, NZDJPY formed the Bearish Symmetrical Triangle pattern. This pattern signals a further downward trend in case the lower border 84.58 is breached. Here
The M5 and M15 time frames may have more false entry points.
Open chart in a new window
Double Top
was formed on 22.05 at 23:00:29 (UTC+0)
signal strength 4 of 5
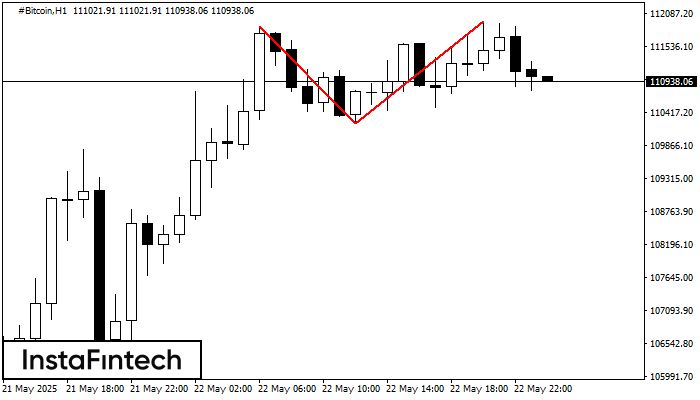
On the chart of #Bitcoin H1 the Double Top reversal pattern has been formed. Characteristics: the upper boundary 111951.72; the lower boundary 110239.46; the width of the pattern 171226 points
Open chart in a new window
Bearish Symmetrical Triangle
was formed on 22.05 at 22:01:48 (UTC+0)
signal strength 3 of 5
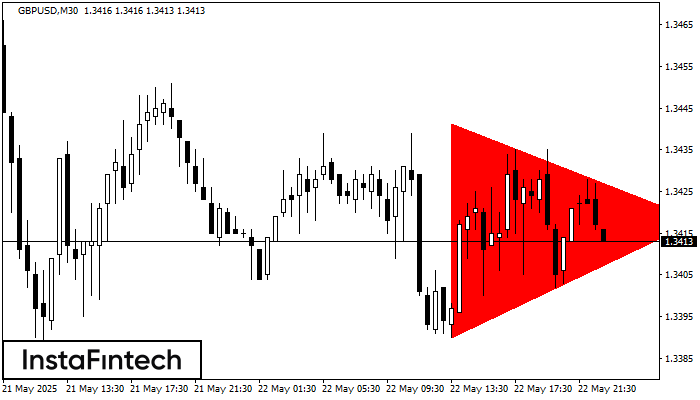
According to the chart of M30, GBPUSD formed the Bearish Symmetrical Triangle pattern. This pattern signals a further downward trend in case the lower border 1.3390 is breached. Here
Open chart in a new window


