

Corak sebenar

Double Bottom
was formed on 26.03 at 05:00:29 (UTC+0)
signal strength 4 of 5
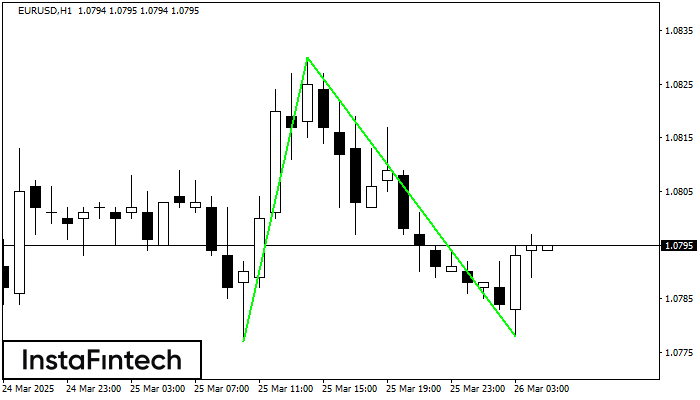
The Double Bottom pattern has been formed on EURUSD H1; the upper boundary is 1.0830; the lower boundary is 1.0778. The width of the pattern is 53 points. In case of a break of the upper boundary 1.0830, a change in the trend can be predicted where the width of the pattern will coincide with the distance to a possible take profit level.
- All
- All
- Bearish Rectangle
- Bearish Symmetrical Triangle
- Bearish Symmetrical Triangle
- Bullish Rectangle
- Double Top
- Double Top
- Triple Bottom
- Triple Bottom
- Triple Top
- Triple Top
- All
- All
- Buy
- Sale
- All
- 1
- 2
- 3
- 4
- 5
Double Top
was formed on 18.04 at 04:10:38 (UTC+0)
signal strength 1 of 5
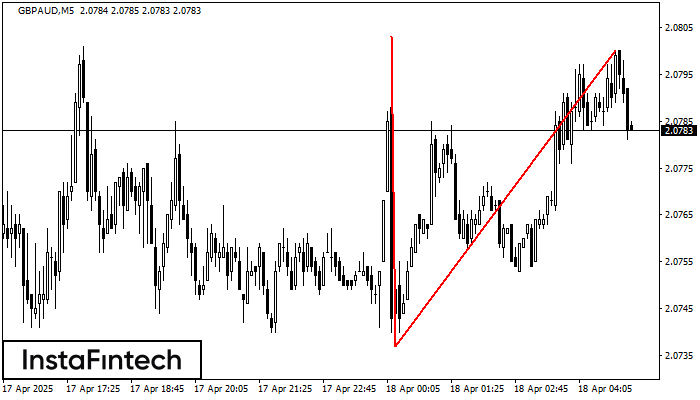
Corak pembalikan Double Top telah dibentuk pada GBPAUD M5. Ciri-ciri: sempadan atas %P0.000000; sempadan bawah 2.0803; sempadan bawah 2.0737; lebar corak adalah 63 mata. Dagangan menjual adalah lebih baik untuk
Carta masa M5 dan M15 mungkin mempunyai lebih banyak titik kemasukan palsu.
Open chart in a new window
Double Top
was formed on 18.04 at 04:00:48 (UTC+0)
signal strength 3 of 5
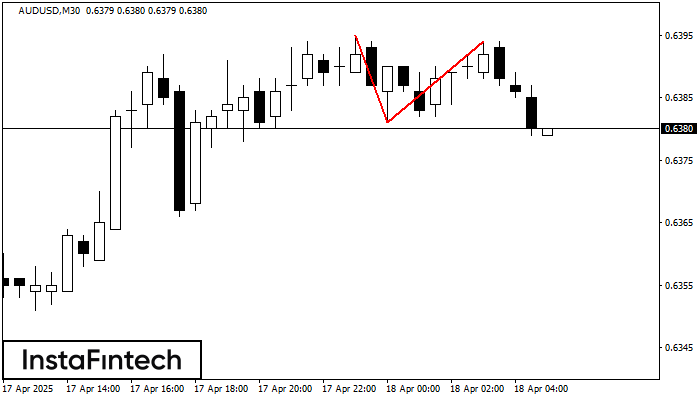
Pada carta AUDUSD M30 corak pembalikan Double Top telah terbentuk. Ciri-ciri: sempadan atas 0.6394; sempadan bawah 0.6381; lebar corak 13 mata. Isyarat: penembusan sempadan bawah akan menyebabkan kesinambungan arah aliran
Open chart in a new window
Double Bottom
was formed on 18.04 at 03:05:35 (UTC+0)
signal strength 1 of 5
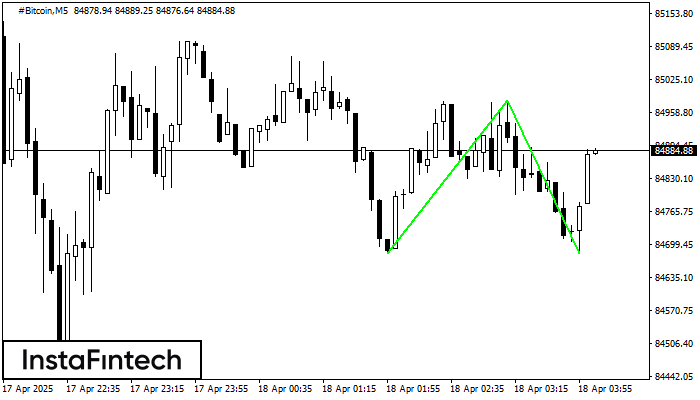
Corak Double Bottom telah dibentuk pada #Bitcoin M5. Ciri-ciri: tahap sokongan 84682.60; tahap rintangan 84984.00; lebar corak 30140 mata. Sekiranya tahap rintangan ditembusi, perubahan aliran boleh diramalkan dengan titik sasaran
Carta masa M5 dan M15 mungkin mempunyai lebih banyak titik kemasukan palsu.
Open chart in a new window


