

Corak sebenar

Double Bottom
was formed on 26.03 at 02:30:14 (UTC+0)
signal strength 3 of 5
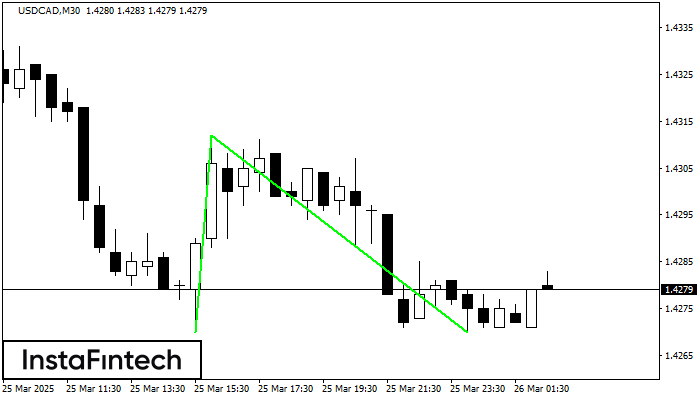
The Double Bottom pattern has been formed on USDCAD M30. Characteristics: the support level 1.4270; the resistance level 1.4312; the width of the pattern 42 points. If the resistance level is broken, a change in the trend can be predicted with the first target point lying at the distance of 42 points.
- All
- All
- Bearish Rectangle
- Bearish Symmetrical Triangle
- Bearish Symmetrical Triangle
- Bullish Rectangle
- Double Top
- Double Top
- Triple Bottom
- Triple Bottom
- Triple Top
- Triple Top
- All
- All
- Buy
- Sale
- All
- 1
- 2
- 3
- 4
- 5
Bearish Rectangle
was formed on 09.05 at 02:22:04 (UTC+0)
signal strength 3 of 5
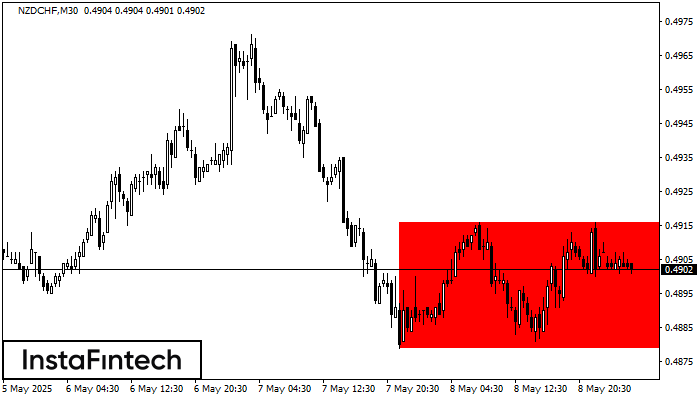
According to the chart of M30, NZDCHF formed the Bearish Rectangle. The pattern indicates a trend continuation. The upper border is 0.4916, the lower border is 0.4879. The signal means
Open chart in a new window
Bearish Rectangle
was formed on 09.05 at 02:21:54 (UTC+0)
signal strength 4 of 5
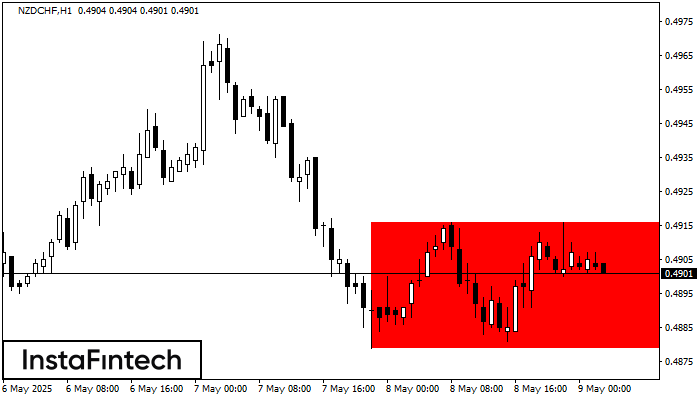
According to the chart of H1, NZDCHF formed the Bearish Rectangle. The pattern indicates a trend continuation. The upper border is 0.4916, the lower border is 0.4879. The signal means
Open chart in a new window
Double Top
was formed on 09.05 at 02:15:13 (UTC+0)
signal strength 2 of 5
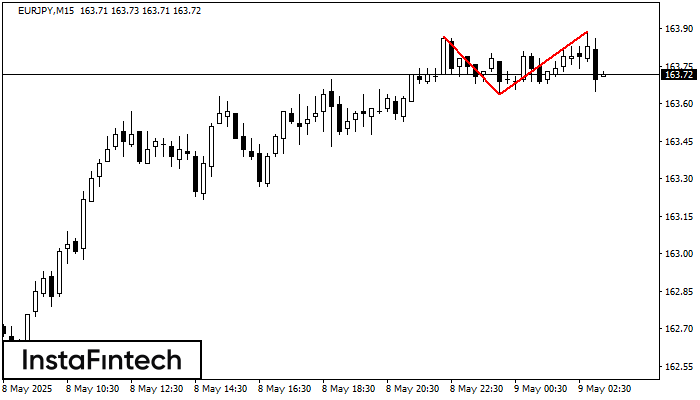
On the chart of EURJPY M15 the Double Top reversal pattern has been formed. Characteristics: the upper boundary 163.89; the lower boundary 163.64; the width of the pattern 25 points
The M5 and M15 time frames may have more false entry points.
Open chart in a new window

