

Corak sebenar

Bearish Symmetrical Triangle
was formed on 25.03 at 21:36:34 (UTC+0)
signal strength 2 of 5
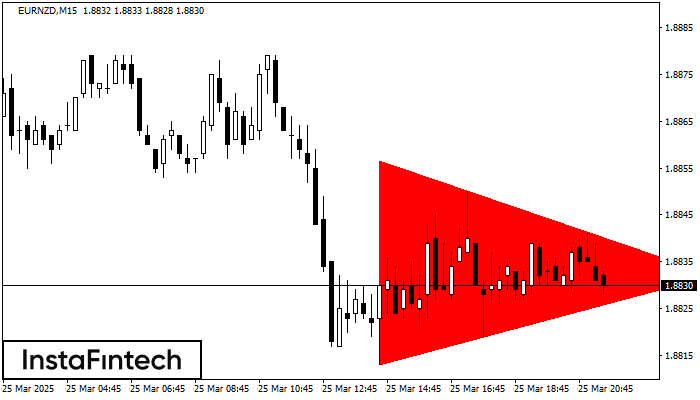
According to the chart of M15, EURNZD formed the Bearish Symmetrical Triangle pattern. Trading recommendations: A breach of the lower border 1.8813 is likely to encourage a continuation of the downward trend.
The M5 and M15 time frames may have more false entry points.
Juga lihat
- All
- All
- Bearish Rectangle
- Bearish Symmetrical Triangle
- Bearish Symmetrical Triangle
- Bullish Rectangle
- Double Top
- Double Top
- Triple Bottom
- Triple Bottom
- Triple Top
- Triple Top
- All
- All
- Buy
- Sale
- All
- 1
- 2
- 3
- 4
- 5
Triple Top
was formed on 08.05 at 19:40:27 (UTC+0)
signal strength 1 of 5
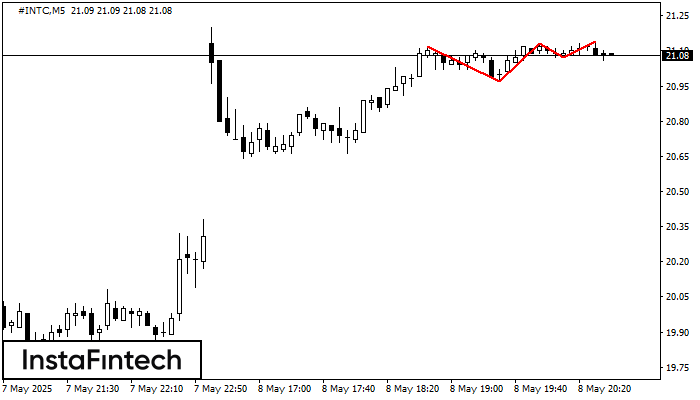
The Triple Top pattern has formed on the chart of the #INTC M5. Features of the pattern: borders have an ascending angle; the lower line of the pattern
The M5 and M15 time frames may have more false entry points.
Open chart in a new window
Bullish Rectangle
was formed on 08.05 at 19:25:47 (UTC+0)
signal strength 1 of 5
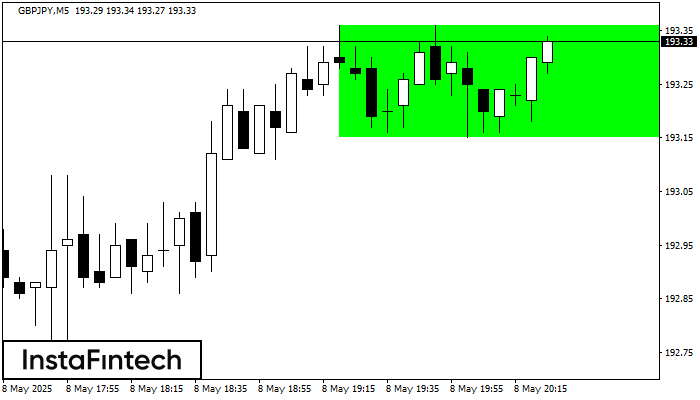
According to the chart of M5, GBPJPY formed the Bullish Rectangle. The pattern indicates a trend continuation. The upper border is 193.36, the lower border is 193.15. The signal means
The M5 and M15 time frames may have more false entry points.
Open chart in a new window
Double Bottom
was formed on 08.05 at 19:20:20 (UTC+0)
signal strength 1 of 5
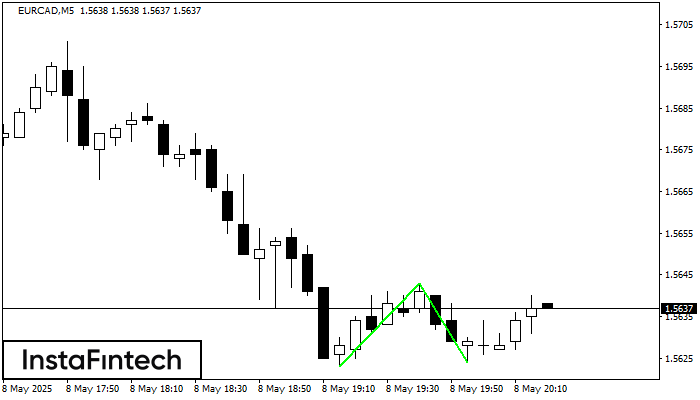
The Double Bottom pattern has been formed on EURCAD M5; the upper boundary is 1.5643; the lower boundary is 1.5624. The width of the pattern is 20 points. In case
The M5 and M15 time frames may have more false entry points.
Open chart in a new window


