

Corak sebenar

Double Bottom
was formed on 25.03 at 21:15:39 (UTC+0)
signal strength 2 of 5
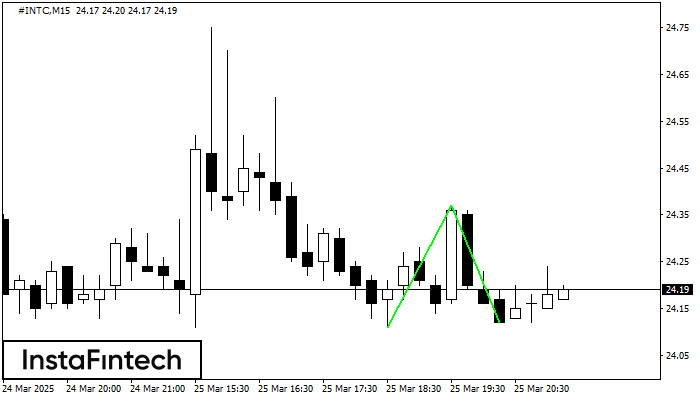
The Double Bottom pattern has been formed on #INTC M15; the upper boundary is 24.37; the lower boundary is 24.12. The width of the pattern is 26 points. In case of a break of the upper boundary 24.37, a change in the trend can be predicted where the width of the pattern will coincide with the distance to a possible take profit level.
The M5 and M15 time frames may have more false entry points.
Juga lihat
- All
- All
- Bearish Rectangle
- Bearish Symmetrical Triangle
- Bearish Symmetrical Triangle
- Bullish Rectangle
- Double Top
- Double Top
- Triple Bottom
- Triple Bottom
- Triple Top
- Triple Top
- All
- All
- Buy
- Sale
- All
- 1
- 2
- 3
- 4
- 5
Двойное дно
сформирован 07.05 в 12:20:04 (UTC+0)
сила сигнала 1 из 5
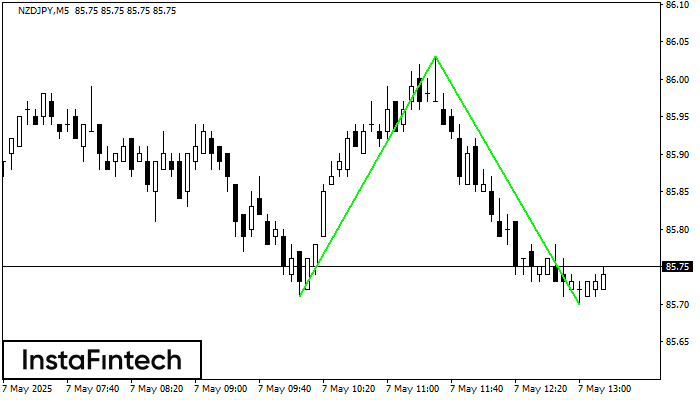
Сформирована фигура «Двойное дно» на графике NZDJPY M5. Характеристика: Уровень поддержки 85.71; Уровень сопротивления 86.03; Ширина фигуры 32 пунктов. В случае пробоя уровня сопротивления можно будет прогнозировать изменение тенденции
Таймфреймы М5 и М15 могут иметь больше ложных точек входа.
Открыть график инструмента в новом окне
Медвежий симметричный треугольник
сформирован 07.05 в 11:37:52 (UTC+0)
сила сигнала 2 из 5

По USDCHF M15 сформировалась фигура «Медвежий симметричный треугольник». Данная фигура сигнализирует нам о продолжении нисходящего тренда в случае пробоя нижней границы 0.8211, где вероятная прибыль будет являться шириной текущей фигуры
Таймфреймы М5 и М15 могут иметь больше ложных точек входа.
Открыть график инструмента в новом окне
Медвежий симметричный треугольник
сформирован 07.05 в 11:37:50 (UTC+0)
сила сигнала 3 из 5
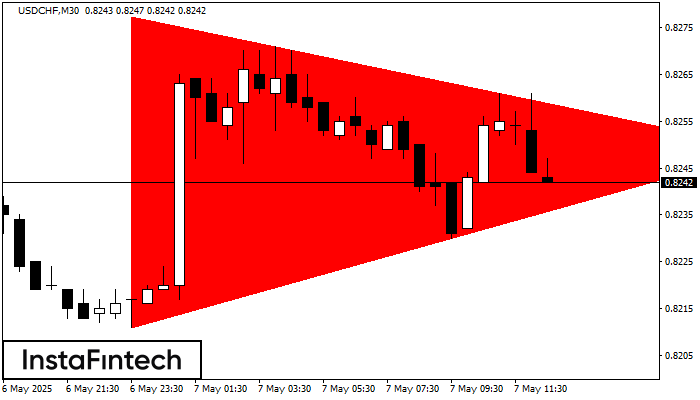
По USDCHF M30 сформировалась фигура «Медвежий симметричный треугольник». Данная фигура сигнализирует нам о продолжении нисходящего тренда в случае пробоя нижней границы 0.8211, где вероятная прибыль будет являться шириной текущей фигуры
Открыть график инструмента в новом окне


