

Corak sebenar

Bullish Rectangle
was formed on 25.03 at 20:59:12 (UTC+0)
signal strength 1 of 5
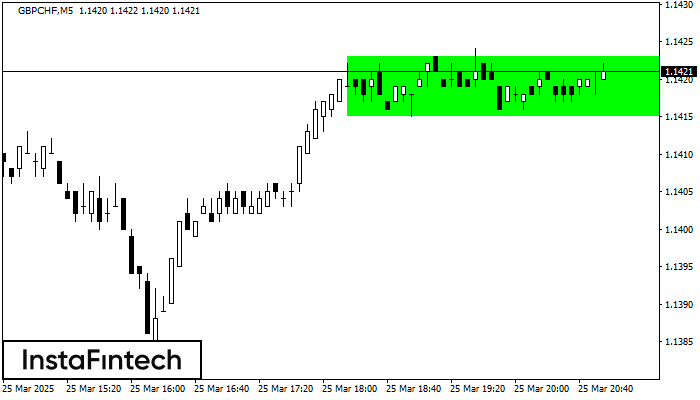
According to the chart of M5, GBPCHF formed the Bullish Rectangle. The pattern indicates a trend continuation. The upper border is 1.1423, the lower border is 1.1415. The signal means that a long position should be opened above the upper border 1.1423 of the Bullish Rectangle.
The M5 and M15 time frames may have more false entry points.
- All
- All
- Bearish Rectangle
- Bearish Symmetrical Triangle
- Bearish Symmetrical Triangle
- Bullish Rectangle
- Double Top
- Double Top
- Triple Bottom
- Triple Bottom
- Triple Top
- Triple Top
- All
- All
- Buy
- Sale
- All
- 1
- 2
- 3
- 4
- 5
Segi Tiga Simetri Menurun
was formed on 09.05 at 12:20:11 (UTC+0)
signal strength 1 of 5
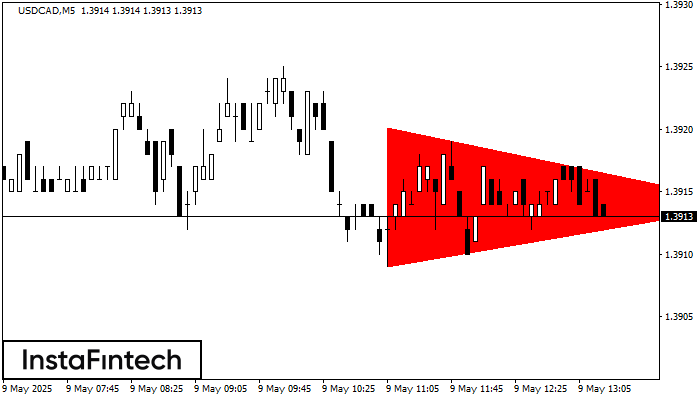
Berdasarkan carta M5, USDCAD membentuk corak Segi Tiga Simetri Menurun. Penerangan: Sempadan yang lebih rendah ialah 1.3909/1.3914 dan sempadan atas adalah 1.3920/1.3914. Lebar corak diukur pada carta pada -11 pips
Carta masa M5 dan M15 mungkin mempunyai lebih banyak titik kemasukan palsu.
Open chart in a new window
Triple Top
was formed on 09.05 at 12:14:47 (UTC+0)
signal strength 2 of 5
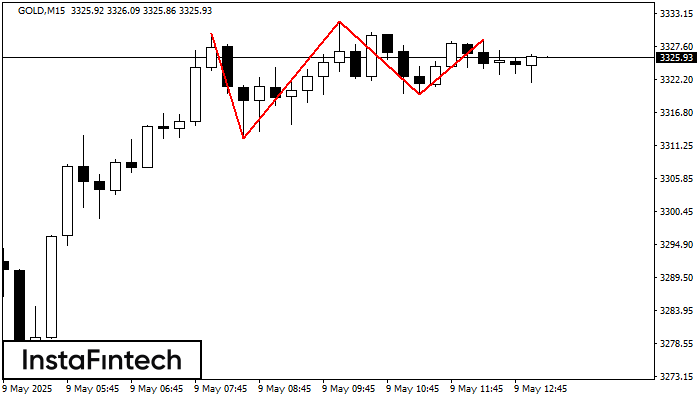
Pada carta instrumen dagangan GOLD M15, corak Triple Top yang menandakan perubahan aliran telah terbentuk. Adalah mungkin bahawa selepas pembentukan bahagian atas ketiga, harga akan cuba menembusi tahap rintangan 3312.44
Carta masa M5 dan M15 mungkin mempunyai lebih banyak titik kemasukan palsu.
Open chart in a new window
Segi Tiga Simetri Menaik
was formed on 09.05 at 12:11:48 (UTC+0)
signal strength 1 of 5
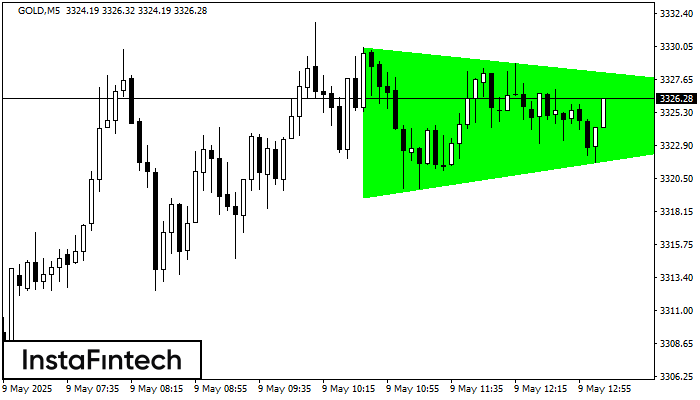
Berdasarkan carta M5, GOLD membentuk corak Segi Tiga Simetri Menaik yang menandakan aliran akan berterusan. Penerangan. Sempadan atas corak menyentuh koordinat 3329.96/3325.57 sedangkan sempadan bawah merentasi 3319.19/3325.57. Lebar corak diukur
Carta masa M5 dan M15 mungkin mempunyai lebih banyak titik kemasukan palsu.
Open chart in a new window


