

Corak sebenar

Double Top
was formed on 25.03 at 19:25:17 (UTC+0)
signal strength 1 of 5
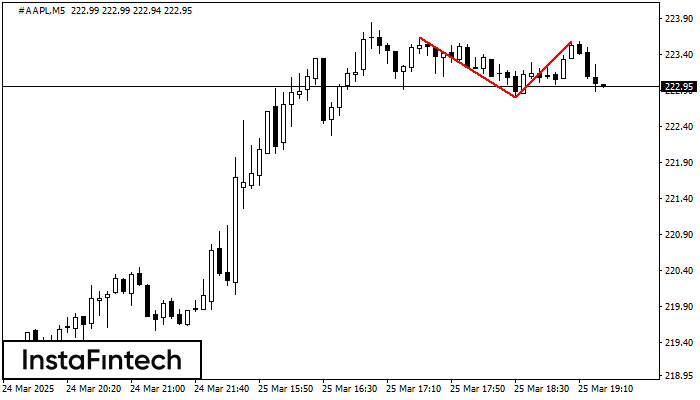
On the chart of #AAPL M5 the Double Top reversal pattern has been formed. Characteristics: the upper boundary 223.58; the lower boundary 222.80; the width of the pattern 78 points. The signal: a break of the lower boundary will cause continuation of the downward trend targeting the 222.65 level.
The M5 and M15 time frames may have more false entry points.
- All
- All
- Bearish Rectangle
- Bearish Symmetrical Triangle
- Bearish Symmetrical Triangle
- Bullish Rectangle
- Double Top
- Double Top
- Triple Bottom
- Triple Bottom
- Triple Top
- Triple Top
- All
- All
- Buy
- Sale
- All
- 1
- 2
- 3
- 4
- 5
Bullish Rectangle
was formed on 11.05 at 01:12:20 (UTC+0)
signal strength 1 of 5

According to the chart of M5, #Bitcoin formed the Bullish Rectangle. The pattern indicates a trend continuation. The upper border is 103800.29, the lower border is 103508.08. The signal means
The M5 and M15 time frames may have more false entry points.
Open chart in a new window
Double Top
was formed on 11.05 at 00:45:18 (UTC+0)
signal strength 1 of 5

On the chart of #Bitcoin M5 the Double Top reversal pattern has been formed. Characteristics: the upper boundary 103800.29; the lower boundary 103508.08; the width of the pattern 29221 points
The M5 and M15 time frames may have more false entry points.
Open chart in a new window
Bullish Rectangle
was formed on 09.05 at 22:57:29 (UTC+0)
signal strength 1 of 5

According to the chart of M5, GBPJPY formed the Bullish Rectangle. The pattern indicates a trend continuation. The upper border is 193.44, the lower border is 193.24. The signal means
The M5 and M15 time frames may have more false entry points.
Open chart in a new window

