

Corak sebenar

Bearish Rectangle
was formed on 25.03 at 18:57:08 (UTC+0)
signal strength 1 of 5
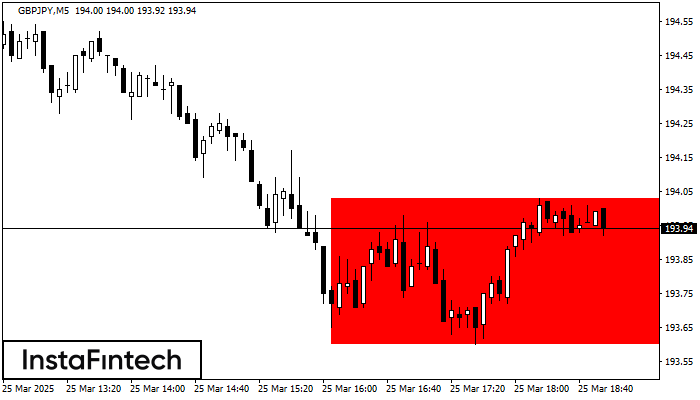
According to the chart of M5, GBPJPY formed the Bearish Rectangle which is a pattern of a trend continuation. The pattern is contained within the following borders: lower border 193.60 – 193.60 and upper border 194.03 – 194.03. In case the lower border is broken, the instrument is likely to follow the downward trend.
The M5 and M15 time frames may have more false entry points.
Juga lihat
- All
- All
- Bearish Rectangle
- Bearish Symmetrical Triangle
- Bearish Symmetrical Triangle
- Bullish Rectangle
- Double Top
- Double Top
- Triple Bottom
- Triple Bottom
- Triple Top
- Triple Top
- All
- All
- Buy
- Sale
- All
- 1
- 2
- 3
- 4
- 5
ट्रिपल बॉटम
was formed on 21.04 at 22:01:24 (UTC+0)
signal strength 3 of 5

ट्रिपल बॉटम पैटर्न USDJPY M30 ट्रेडिंग इंस्ट्रूमेंट के चार्ट पर बना है। 141.08/141.05 के टूटने की स्थिति में पैटर्न नीचे से ऊपर की ओर के ट्रेंड में बदलाव का संकेत
Open chart in a new window
डबल बॉटम
was formed on 21.04 at 22:00:49 (UTC+0)
signal strength 4 of 5

डबल बॉटम पैटर्न AUDCHF H1 पर बना है; ऊपरी सीमा 0.5198 है; निचली सीमा 0.5165 है। पैटर्न की चौड़ाई 34 अंक है। ऊपरी सीमा 0.5198 के टूटने के मामले में
Open chart in a new window
बियरिश सिमेट्रिकल त्रिभुज
was formed on 21.04 at 21:58:31 (UTC+0)
signal strength 1 of 5
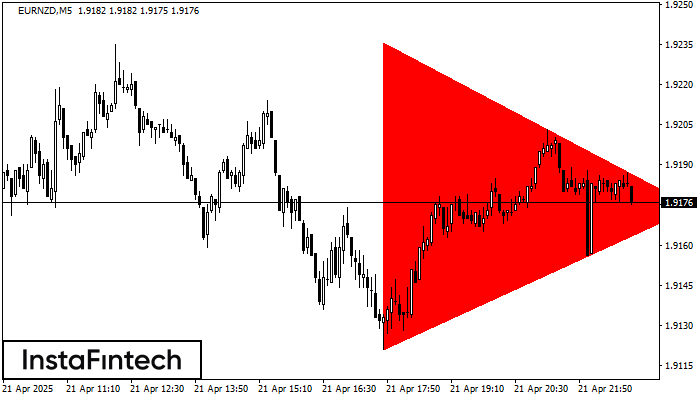
M5 के चार्ट के अनुसार, EURNZD से बियरिश सिमेट्रिकल त्रिभुज पैटर्न बना। विवरण: निचली सीमा 1.9121/1.9174 है और ऊपरी सीमा 1.9236/1.9174 है। पैटर्न की चौड़ाई चार्ट पर -115 पिप्स
M5 और M15 समय सीमा में अधिक फाल्स एंट्री पॉइंट्स हो सकते हैं।
Open chart in a new window


