Lihat juga


 12.02.2024 10:10 AM
At the end of last week, the macroeconomic calendar was relatively empty, with no publication of significant statistical data in the European Union, the United Kingdom, and the United States.
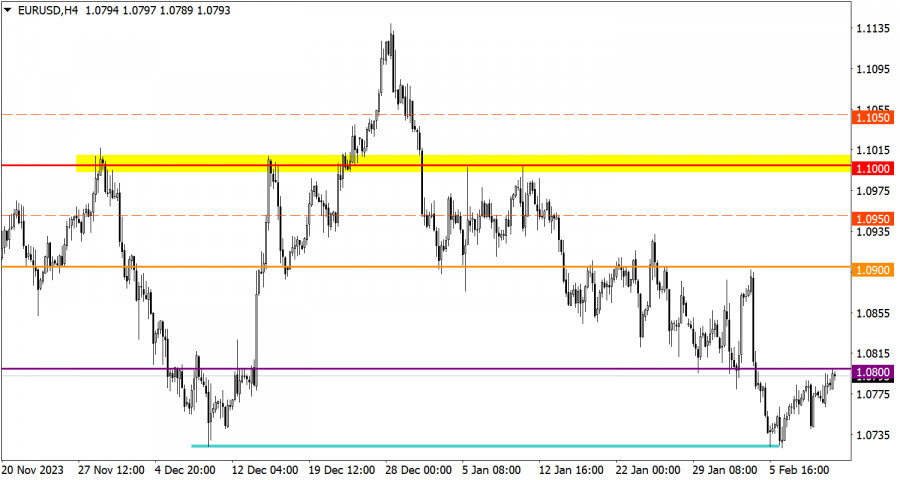
During the pullback, the EUR/USD currency pair returned to the previously passed level of 1.0800. The area of the local low in December serves as a support for sellers, where there has recently been an increase in the volume of long positions.
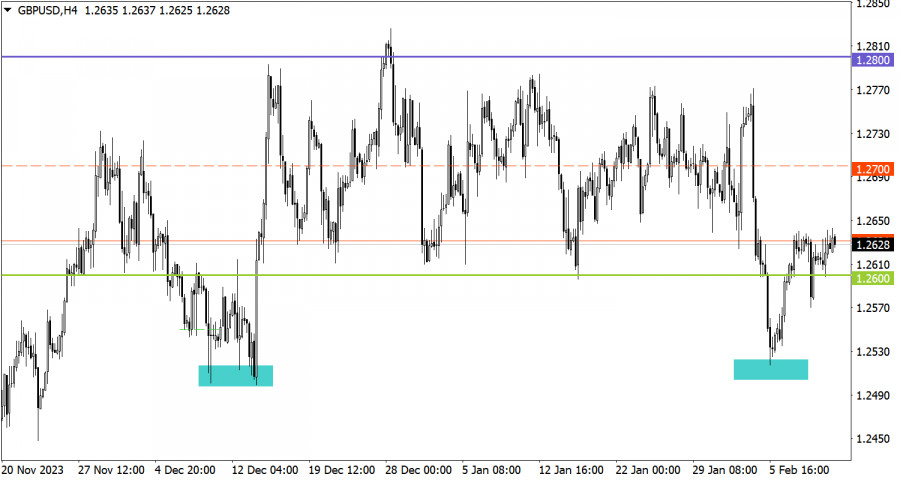
The weekly candle for the GBP/USD pair closed as a doji, indicating uncertainty in the future price movement trajectory. Similar to the situation with the euro, there is increased interest in long positions around the local low in December, and the quote is returning within the previously established sideways channel of 1.2600/1.2800.
Today, the macroeconomic calendar is practically empty, and only a small amount of important statistical data from Europe, the UK, and the United States is expected. However, several representatives of the European Central Bank (ECB) and the Federal Reserve are expected to give a speech, which, theoretically, could lead to increased volatility in financial markets depending on the content of their statements regarding interest rates and the economic situation.
For further increase in the volume of long positions, the price must hold above 1.0800 during the current day. In that case, a subsequent stage of the euro's course recovery is possible. However, in a downward scenario, the level of 1.0800 may become resistance for buyers, and we may observe a new attempt to update the local low established in December.
Maintaining the quote above the level of 1.2600 indicates that short positions are under pressure from buyers. In connection with this, the scenario of resuming the range of 1.2600/1.2800 remains relevant. Regarding the downward scenario, simply holding the level below 1.2600 is not sufficient; to confirm it, the quote needs to update the December low, reaching a value of around 1.2500.
The candlestick chart type is white and black graphic rectangles with lines above and below. With a detailed analysis of each individual candle, you can see its characteristics relative to a particular time frame: opening price, closing price, intraday high and low.
Horizontal levels are price coordinates, relative to which a price may stop or reverse its trajectory. In the market, these levels are called support and resistance.
Circles and rectangles are highlighted examples where the price reversed in history. This color highlighting indicates horizontal lines that may put pressure on the asset's price in the future.
The up/down arrows are landmarks of the possible price direction in the future.
You have already liked this post today
* Analisis pasaran yang disiarkan di sini adalah bertujuan untuk meningkatkan kesedaran anda, tetapi tidak untuk memberi arahan untuk membuat perdagangan.
Analisis Dagangan Khamis: Pasangan GBP/USD carta 1 Jam. Pasangan GBP/USD meneruskan pergerakan menaiknya pada hari Khamis, walaupun terdapat lebih sedikit alasan untuknya berbanding pasangan EUR/USD. Tiada sebarang berita atau penerbitan
Analisis Dagangan Khamis: Pasangan EUR/USD 1-Jam. Pasangan mata wang EUR/USD terus mengalami pergerakan ke atas pada hari Khamis, selaras dengan aliran semasa. Tidak terdapat sebarang sebab untuk peningkatan baharu mata
Analisis GBP/USD carta 5-Minit Pasangan mata wang GBP/USD meneruskan pergerakan menaiknya pada hari Khamis, walaupun sekali lagi tiada sebab yang jelas untuknya. Pound British terus meningkat hampir dalam setiap keadaan
Analisis EUR/USD carta 5-Minit Pasangan mata wang EUR/USD meneruskan dagangan dengan kenaikan pada hari Khamis. Malah pelonggaran dasar monetari terbaharu oleh ECB tidak mampu menyelamatkan dolar. Semalam, pengawal selia Eropah
Dalam ramalan pagi, saya memberi tumpuan pada tahap 1.3562 dan merancang untuk membuat keputusan kemasukan pasaran di sekitarnya. Mari kita lihat carta 5 minit dan lihat apakah yang berlaku. Peningkatan
Analisis Dagangan Hari Rabu Carta 1 Jam pasangan GBP/USD Pasangan GBP/USD meneruskan pergerakan menaiknya pada hari Rabu, selaras dengan arah aliran baharu. Sebagai peringatan, harga sebelum ini telah menetap
Pada hari Rabu, pasangan mata wang EUR/USD didagangkan dengan volatiliti rendah dan kecenderungan menaik. Kami menjangkakan bahawa latar belakang makroekonomi tidak akan memberi kesan besar kepada pergerakan pasangan ini, namun
Pada hari Rabu, pasangan mata wang GBP/USD juga didagangkan lebih tinggi, walaupun turun naik kekal rendah. Namun begitu, pound Britain meningkat sepanjang hari. Walaupun tiada sebab yang kukuh untuk
Analisis EUR/USD carta 5-Minit Pada hari Rabu, pasangan mata wang EUR/USD sekali lagi didagangkan lebih tinggi. Sebaik sahaja pasangan ini memulakan pembetulan walaupun kecil, pasaran segera menemui alasan baharu untuk
Dalam ramalan saya pagi ini, saya menumpukan perhatian pada tahap 1.3536 dan merancang untuk membuat keputusan perdagangan berdasarkan tahap tersebut. Mari kita lihat carta 5 minit dan lihat apa yang
Kelab InstaTrade

Your IP address shows that you are currently located in the USA. If you are a resident of the United States, you are prohibited from using the services of InstaFintech Group including online trading, online transfers, deposit/withdrawal of funds, etc.
If you think you are seeing this message by mistake and your location is not the US, kindly proceed to the website. Otherwise, you must leave the website in order to comply with government restrictions.
Why does your IP address show your location as the USA?
Please confirm whether you are a US resident or not by clicking the relevant button below. If you choose the wrong option, being a US resident, you will not be able to open an account with InstaTrade anyway.
We are sorry for any inconvenience caused by this message.


