Lihat juga


 27.11.2023 09:33 PM
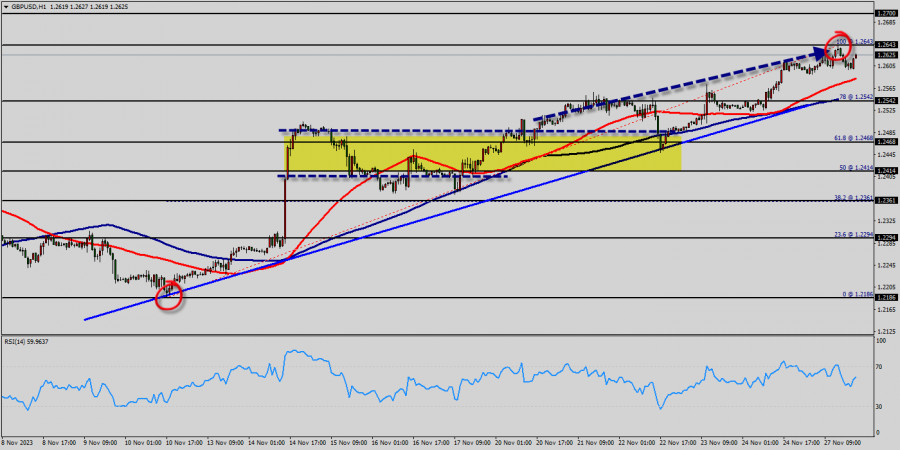
On the one-hour chart, the GBP/USD pair continues moving in a bullish trend from the support levels of 1.2468 and 1.2542. Currently, the price is in a bullish channel. This is confirmed by the RSI indicator signaling that we are still in a bullish trending market.
As the price is still above the moving average (100), immediate support is seen at 1.2468, which coincides with a golden ratio (61.8% of Fibonacci). Consequently, the first support is set at the level of 1.2468.
Since the trend is above the 61.8% Fibonacci level (1.2468), the market is still in an uptrend. From this point, the GBP/USD pair is continuing in a bullish trend from the new support of 1.2468. Currently, the price is in a bullish channel. According to the previous events, we expect the GBP/USD pair to move between 1.2468 and 1.2700 in coming days.
So, the market is likely to show signs of a bullish trend around the spot of 1.2468. In other words, buy orders are recommended above the golden ratio (1.2468) with the first target at the level of 1.2643.
Furthermore, if the trend is able to breakout through the first resistance level of 1.2643. We should see the pair climbing towards the double top (1.2700) to test it. It would also be wise to consider where to place a stop loss; this should be set below the second support of 1.2468.
You have already liked this post today
* Analisis pasaran yang disiarkan di sini adalah bertujuan untuk meningkatkan kesedaran anda, tetapi tidak untuk memberi arahan untuk membuat perdagangan.
Pada hari Khamis, pasangan EUR/USD meneruskan pergerakan kenaikannya dan berjaya membuat pengukuhan di atas paras 100.0% anjakan semula Fibonacci pada 1.1574. Namun, sepanjang malam, berlaku pembalikan mendadak memihak kepada dolar
Selamat sejahtera, para pedagang yang dihormati! Pada hari Rabu, pasangan EUR/USD meneruskan pergerakan menaik setelah melantun semula dari zon sokongan 1.1374–1.1380. Ia berjaya disokong di atas tahap pemulihan semula Fibonacci
Jika kita melihat carta harian bagi instrumen komoditi Minyak Mentah, terdapat Perbezaan di antara pergerakan harga #CL dan penunjuk Pengayun Stochastic, yang menunjukkan kemungkinan #CL akan mengalami pembetulan penyusutan dalam
Pada carta 4 jam indeks Nasdaq 100, terdapat perbezaan antara pergerakan harga dan penunjuk Pengayun Stochastic, terutamanya dengan pengesahan pergerakan harga semasa #NDX yang bergerak di bawah EMA (21), maka
Jika harga euro jatuh di bawah 1.1500 dalam beberapa jam akan datang, ini boleh dilihat sebagai peluang untuk menjual. Dari sudut teknikal, ia kelihatan terlebih belian pada carta
Aliran XAU/USD kekal dalam fasa kenaikan selagi harga terus membuat pengukuhan di atas paras 3,331. Oleh demikian, adalah wajar untuk membeli emas selagi harga terus membuat pengukuhan di atas paras
Corak grafik
petunjuk.
Notices things
you never will!
E-mel/SMS
pemberitahuan

Your IP address shows that you are currently located in the USA. If you are a resident of the United States, you are prohibited from using the services of InstaFintech Group including online trading, online transfers, deposit/withdrawal of funds, etc.
If you think you are seeing this message by mistake and your location is not the US, kindly proceed to the website. Otherwise, you must leave the website in order to comply with government restrictions.
Why does your IP address show your location as the USA?
Please confirm whether you are a US resident or not by clicking the relevant button below. If you choose the wrong option, being a US resident, you will not be able to open an account with InstaTrade anyway.
We are sorry for any inconvenience caused by this message.

